
A private hospital stay in India costs a patient about 7.6 times a government stay. In the latest national survey, patients paid ₹50,508 out of pocket in private hospitals and ₹6,631 in government ones. In the UK, a private self-pay hip replacement package averages £15,384 across 17 cities. That is about 1.5 times the NHS average unit cost of £10,333.
The US picture is different, because “private” covers two groups. Nonprofit hospitals spent $3,449 per adjusted inpatient day in 2024. For-profit hospitals spent $2,623, and state and local government hospitals spent $3,089. Even so, for-profit hospitals posted the highest list-price markups in Medicare cost reports.
We compiled these figures from hospital cost reports, national surveys and published price lists. Then we worked out the ratios, gaps and growth rates in Python. After each set of numbers, we add what it means for hospitals and the people who market them.
Hospital Cost Gaps by Ownership in Seven Figures
- US nonprofit hospitals spent 31.5% more per adjusted inpatient day than for-profit hospitals in 2024 ($3,449 vs $2,623).
- From 2009 to 2024, expenses per day rose 91.7% at government hospitals, 76.3% at nonprofits and 66.7% at for-profits.
- 49 of the 50 US hospitals with the highest charge-to-cost ratios in 2012 were for-profit. Their charges were about 10 times their Medicare-allowed cost.
- For a brain MRI, nonprofits were paid $387 more than for-profits in the same region. Government hospitals were paid $537 more.
- Government hospitals gave $4.1 of charity care per $100 of expenses in 2018, for-profits $3.8 and nonprofits $2.3.
- In India, the median private hospital stay cost ₹24,000 out of pocket, 21.8 times the ₹1,100 government median.
- A UK private cataract package averages £2,924 per eye. That is 1.99 times the NHS unit cost of £1,473.

How US Hospitals Split Between Nonprofit, For-Profit and Government Owners
The US had 5,121 community hospitals in 2024 AHA survey data. Of these, 2,984 were nonprofit, 1,224 were investor-owned and 913 were run by state or local government. Another 210 were federal hospitals.
| Ownership | Community hospitals | Share of community hospitals |
|---|---|---|
| Nongovernment nonprofit | 2,984 | 58.3% |
| Investor-owned (for-profit) | 1,224 | 23.9% |
| State and local government | 913 | 17.8% |
| Total | 5,121 | 100% |
So most “private” US hospitals are nonprofits. They are private in ownership, but they hold tax exemptions. For-profit chains make up about one in four community hospitals. As a result, a US search for “private hospital cost” mixes two very different business models.
Medigencies takeaway: Few patients know who owns their local hospital. Even so, the owner shapes the bill, the charity care policy and the billing office. Hospital marketers should name the ownership model on the About page in plain words. They should also link the financial assistance policy from every price page.
Expenses per Inpatient Day at Nonprofit, For-Profit and Government Hospitals
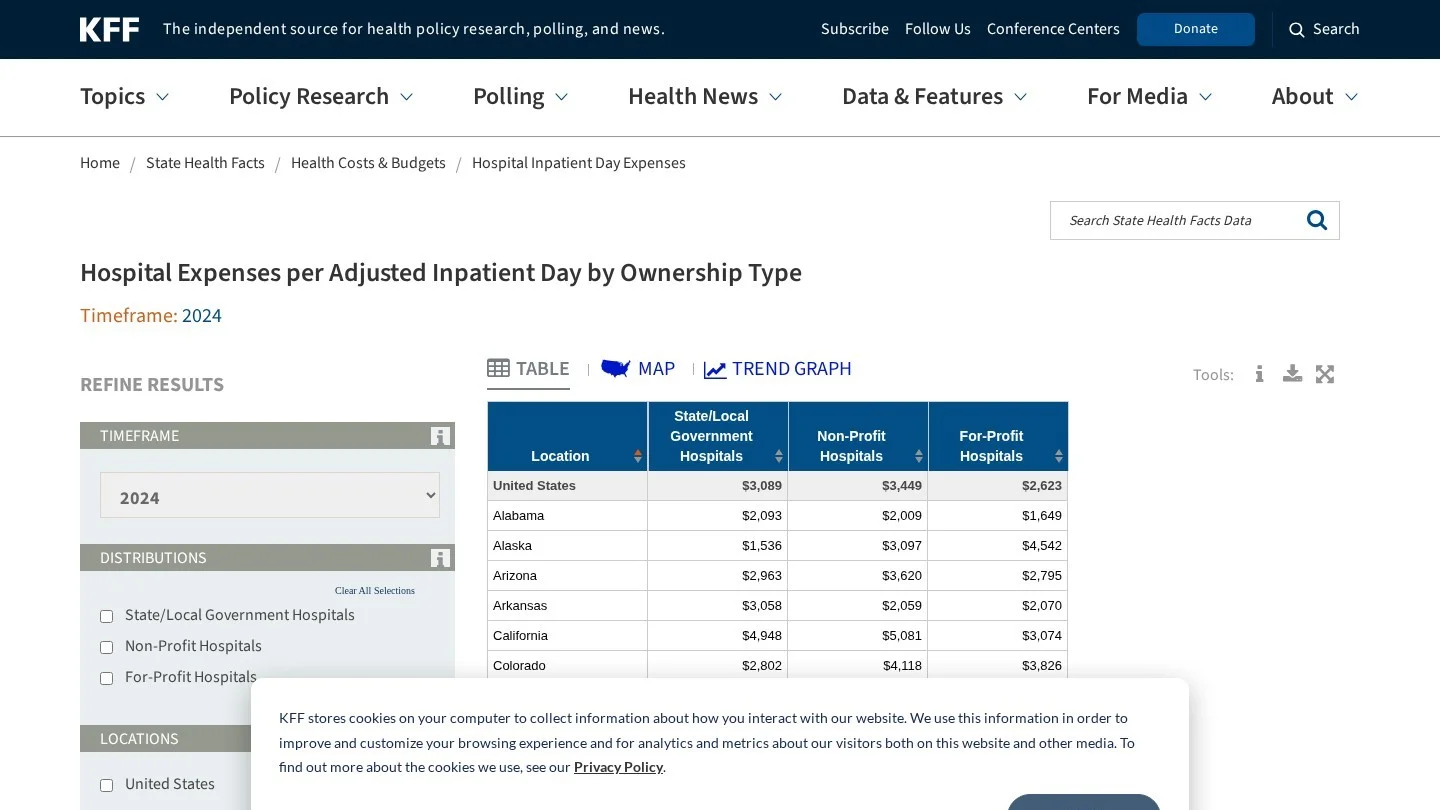
KFF tracks hospital expenses per adjusted inpatient day, using AHA survey data. The figure counts a hospital’s costs and adjusts for outpatient work. It measures what the hospital spends, so it is a cost figure, and the patient’s price can differ.
In 2024, nonprofit hospitals spent $3,449.48 per adjusted day. Government hospitals spent $3,089.06, and for-profit hospitals spent $2,622.65. We calculated that the nonprofit figure is 31.5% higher than the for-profit one. The government figure is 17.8% higher.
Fifteen Years of Cost Growth by Ownership
The gap has widened. In 2009, nonprofits spent $383 more per day than for-profits. By 2024 the gap was $827. In fact, for-profit spending per day was briefly above government spending in 2010, by just $4.
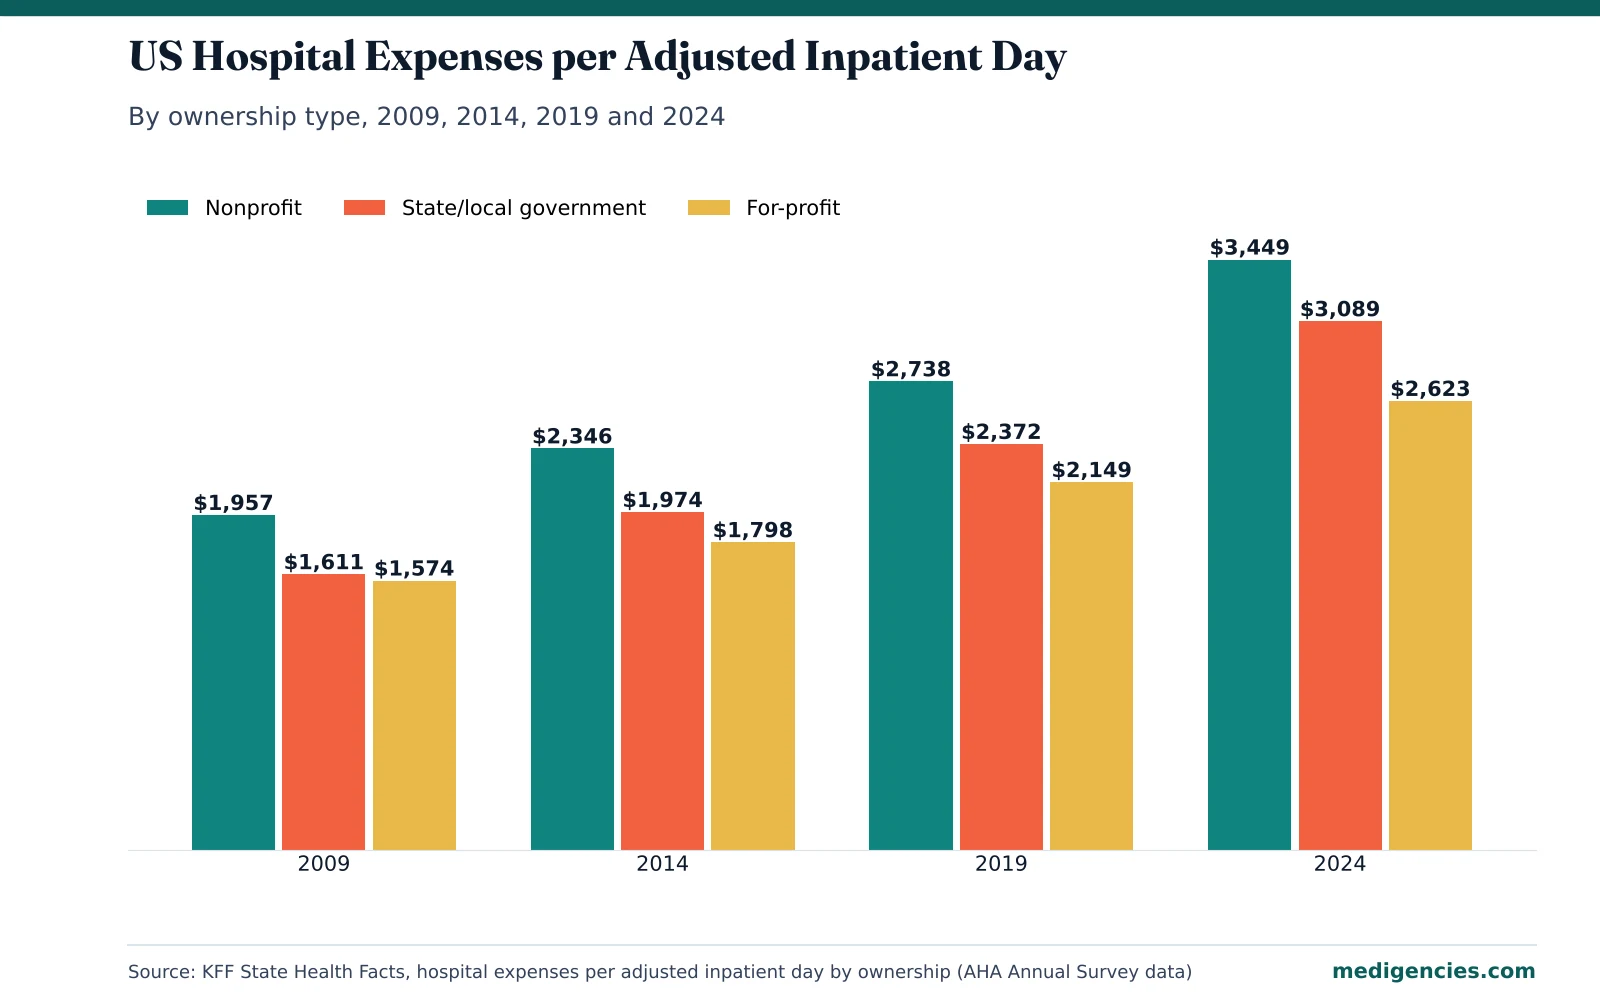
| Ownership | 2009 | 2019 | 2024 | Change 2009 to 2024 | Yearly growth rate |
|---|---|---|---|---|---|
| State/local government | $1,611 | $2,372 | $3,089 | +91.7% | 4.43% |
| Nonprofit | $1,957 | $2,738 | $3,449 | +76.3% | 3.85% |
| For-profit | $1,574 | $2,149 | $2,623 | +66.7% | 3.46% |
Government hospitals grew fastest over the full period. They also grew fastest from 2019 to 2024, at 30.2%, against 26.0% for nonprofits and 22.0% for for-profits. For a five-day stay at 2024 rates, the cost works out to $17,247 at a nonprofit and $13,113 at a for-profit. That is our own math, and it ignores case mix.
Still, cost per day is not a clean measure of efficiency. Many nonprofit and public hospitals run teaching programs, trauma centers and safety-net care. That work costs more per day. So the gap shows a difference in mission as much as a difference in spending.
Ten Large States Where the Order Flips
The national order does not hold in every state. We pulled the 2024 figures for the ten most populous states and found the order changes often.
| State | Government | Nonprofit | For-profit | Highest spender |
|---|---|---|---|---|
| California | $4,948 | $5,081 | $3,074 | Nonprofit |
| Texas | $4,046 | $3,550 | $2,417 | Government |
| Florida | $2,889 | $3,382 | $2,487 | Nonprofit |
| New York | $3,894 | $4,265 | No value shown | Nonprofit |
| Pennsylvania | $1,276 | $3,268 | $2,589 | Nonprofit |
| Illinois | $3,799 | $3,154 | $3,356 | Government |
| Ohio | $3,983 | $3,710 | $2,366 | Government |
| Georgia | $1,138 | $2,609 | $2,677 | For-profit |
| North Carolina | $2,623 | $3,186 | $2,463 | Nonprofit |
| Michigan | $1,231 | $2,790 | $2,791 | For-profit |
Nonprofits spent the most in five of the ten states. Government hospitals led in Texas, Illinois and Ohio. For-profits led in Georgia and Michigan, though only by $1 per day in Michigan. California had the widest nonprofit lead, at 1.65 times the for-profit figure.
Medigencies takeaway: A national “nonprofit costs more” headline will be wrong in some markets. Before a hospital publishes cost comparisons, it should check its own state’s figures. Then it should talk about the patient’s bill, which is the number people search for.
Where For-Profit Hospitals Charge More and Where They Charge Less
Expenses tell only half the story. Patients and insurers care about price. Three data sets show price from different angles, and they point in different directions.
List-Price Markups in Medicare Cost Reports
In 2012 Medicare cost report data, US hospital charges were 3.4 times their Medicare-allowed cost. However, the 50 hospitals with the highest ratios charged about 10 times cost. Of those 50 hospitals, 49 were for-profit. Community Health Systems ran half of them, and HCA ran more than a quarter.
List prices mostly hit uninsured and out-of-network patients. Insurers negotiate them down. In fact, the payment-to-cost ratio for the 50 hospitals was 1.3, against a national 1.2.
Brain MRI Prices From Hospital Price Files
A 2023 JAMA Network Open research letter used price files from 2,630 hospitals. The mean commercial negotiated price for a brain MRI was $2,268, and the median was $1,900. In the same hospital referral region, nonprofit hospitals were paid $387 more than for-profit hospitals. Government hospitals were paid $537 more.
We set those gaps against the median price. The nonprofit premium equals 20% of the median brain MRI price. The government premium equals 28%. Also, rural hospitals in the same system were paid $363 more than urban ones.
Private Insurers Pay 254% of Medicare
Across all ownership types, employers and private insurers paid 254% of Medicare prices for hospital services in 2022. That figure comes from RAND’s Round 5.1 study, which used 2020 to 2022 claims. Eight states topped 300%, and Arkansas was the only state under 170%. Surgery centers outside hospitals got 171% of Medicare.
For example, take a hospital service that Medicare pays $10,000 for. At the national average, a private plan would pay $25,400. At the Arkansas ceiling it would pay under $17,000, and in the eight high states it would pay more than $30,000. Those are our worked numbers from RAND’s ratios.
| Measure | Nonprofit | For-profit | Government | Data period |
|---|---|---|---|---|
| Expenses per adjusted inpatient day | $3,449 | $2,623 | $3,089 | 2024 |
| Share of the 50 highest-markup hospitals | 1 of 50 (nonprofit and government combined) | 49 of 50 | Included in the 1 of 50 | 2012 |
| Brain MRI negotiated price vs for-profit, same region | +$387 | Baseline | +$537 | Price files, 2023 study |
| Charity care per $100 of expenses | $2.3 | $3.8 | $4.1 | 2018 |
Medigencies takeaway: For-profit hospitals tend to spend less per day and negotiate lower prices for some scans. But their list prices are the highest. So a for-profit hospital that wants self-pay patients should publish its cash price clearly. Meanwhile, a nonprofit facing the MRI gap can steer price shoppers to its lower-cost outpatient imaging sites.
Charity Care per $100 of Hospital Spending
Charity care is free or cut-price care for patients who cannot pay. In 2018 Medicare cost report data, government hospitals gave $4.1 of charity care for every $100 of total expenses. For-profit hospitals gave $3.8, and nonprofits gave $2.3. The study took in 1,024 government, 2,709 nonprofit and 930 for-profit hospitals.
By our math, nonprofits gave 56% as much charity care per dollar as government hospitals. They gave 61% as much as for-profits. Also, half of all US hospitals reported charity care costs of 1.4% or less of operating expenses in 2020.
Medigencies takeaway: Nonprofits get tax breaks, and in return they owe their towns free care. Therefore, a clear financial assistance page is part of a nonprofit’s reputation. Put the income limits and the application on one page. Then link it from the price estimator, the billing FAQ and the emergency department page.
India: Government Versus Private Hospital Bills in Two National Surveys
India has a large private hospital sector. It sits next to free or low-cost government hospitals. The National Sample Survey (NSS) measures what households spend on each hospital stay. We compared two rounds, the 75th (July 2017 to June 2018) and the 80th, released in April 2026.
NSS 75th Round Hospital Bills
In the 75th round, the average medical bill per stay was ₹4,452 in public hospitals. That figure leaves out childbirth. In private hospitals it was ₹31,845. We calculated a multiple of 7.15. In rural areas the multiple was 6.37, and in urban areas it was 8.03.
| Area | Public hospital | Private hospital | Private-to-public multiple |
|---|---|---|---|
| Rural | ₹4,290 | ₹27,347 | 6.37x |
| Urban | ₹4,837 | ₹38,822 | 8.03x |
| All India | ₹4,452 | ₹31,845 | 7.15x |
Private hospitals also handled most stays. Public hospitals took 42% of stays and private hospitals 55%. Charity and NGO hospitals took 2.7%. In cities, the private share rose to 61%.
Childbirth and Caesarean Costs
Childbirth shows the same pattern. A caesarean in a private hospital cost ₹29,406 in rural areas and ₹37,508 in urban areas. In government hospitals the figures were ₹5,423 and ₹5,504. Besides, over 92% of births in government hospitals were free, against 1% in private hospitals.
| Childbirth type | Area | Government | Private | Multiple |
|---|---|---|---|---|
| Normal delivery | Rural | ₹2,084 | ₹12,931 | 6.2x |
| Normal delivery | Urban | ₹2,459 | ₹17,960 | 7.3x |
| Caesarean | Rural | ₹5,423 | ₹29,406 | 5.4x |
| Caesarean | Urban | ₹5,504 | ₹37,508 | 6.8x |
Caesarean rates differ too. About 55% of private hospital births were surgical, against about 17% in government hospitals. So the average private childbirth bill carries more surgery as well as higher prices.
What Patients Paid in the NSS 80th Round
The 80th round measures what patients paid out of pocket for each stay. Government hospitals averaged ₹6,631. Private hospitals averaged ₹50,508. Charity and trust hospitals averaged ₹39,530. We calculated the private multiple at 7.62.
The medians show a wider gap. The median government stay cost ₹1,100 out of pocket, and the median private stay ₹24,000. That is a 21.8 times gap. The median government stay is only 17% of the government average, so a few costly cases pull the average up.
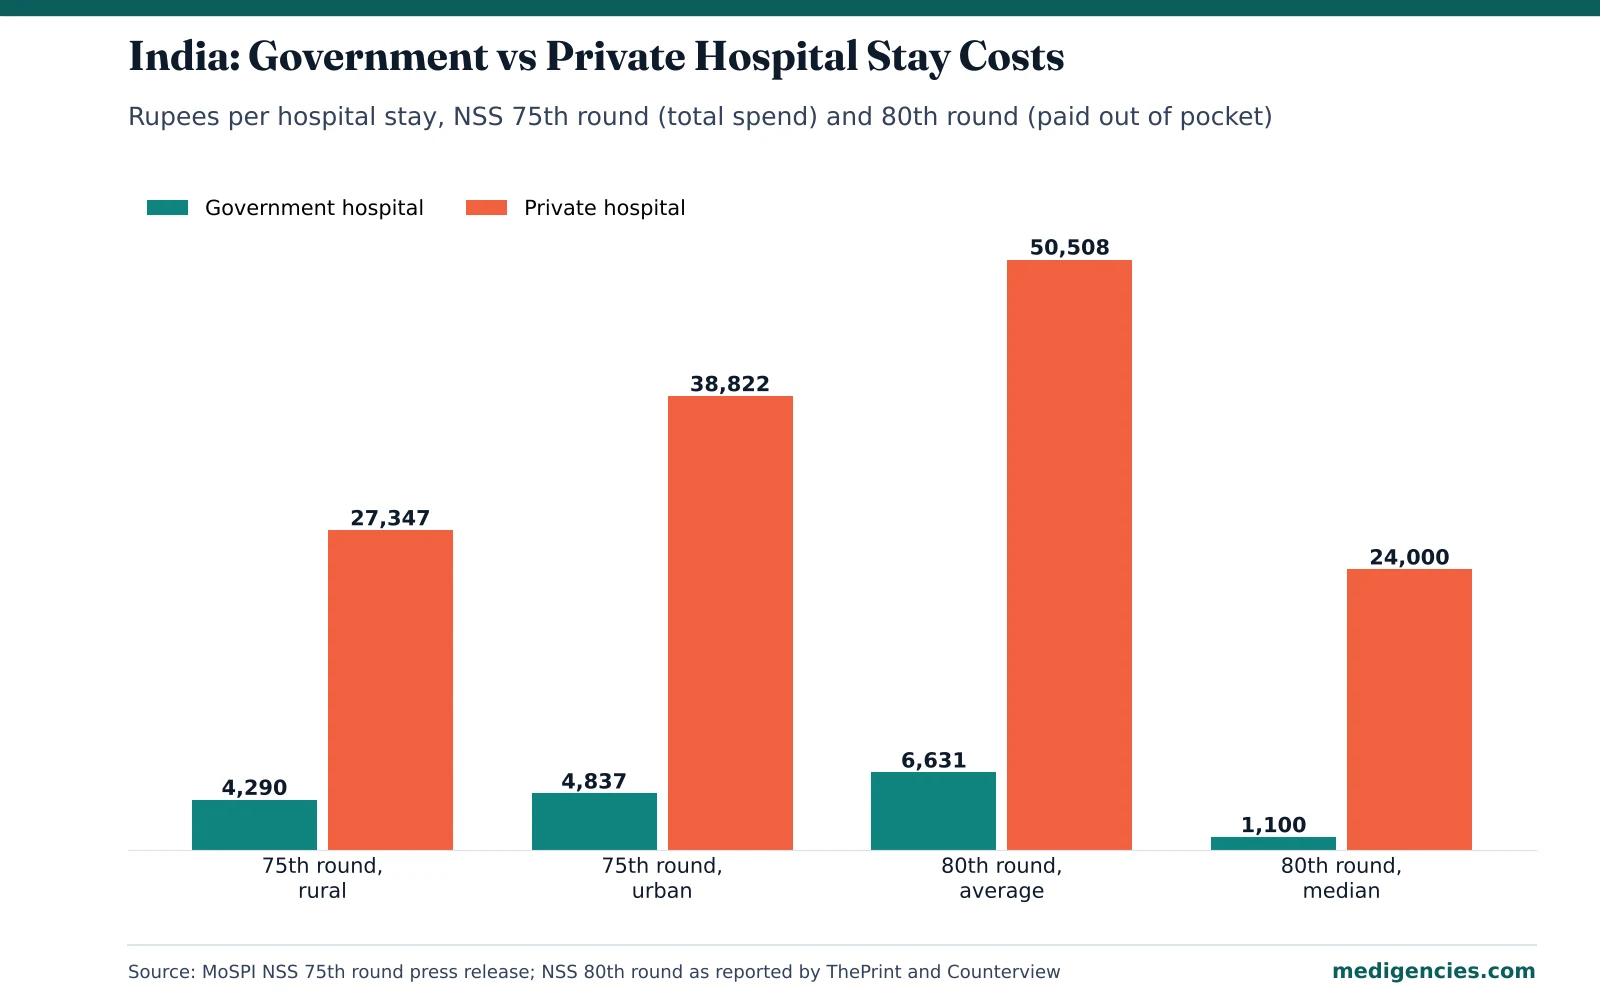
The two rounds use different measures. Even so, the out of pocket part alone in the 80th round sits 59% above the full average private bill in 2017-18. State figures vary a lot. Private stays averaged ₹74,168 in Tamil Nadu and ₹64,228 in Telangana.
Medigencies takeaway: Most Indian patients pick private hospitals even though they cost more. So the price gap is the first thing a family weighs. Private hospitals should publish package prices for common procedures, along with what each package includes. They should also state which insurance and government schemes they accept. Government hospital pages, by contrast, should explain free services and how to get an appointment.
UK: NHS Unit Costs Against Private Self-Pay Packages
NHS care is free at the point of use, so UK patients only see a price when they go private. We compared NHS average unit costs with published private self-pay package prices. The NHS figures cover 2023/24. The private prices were collected in March 2026, so this is a cost-to-price comparison across different periods.
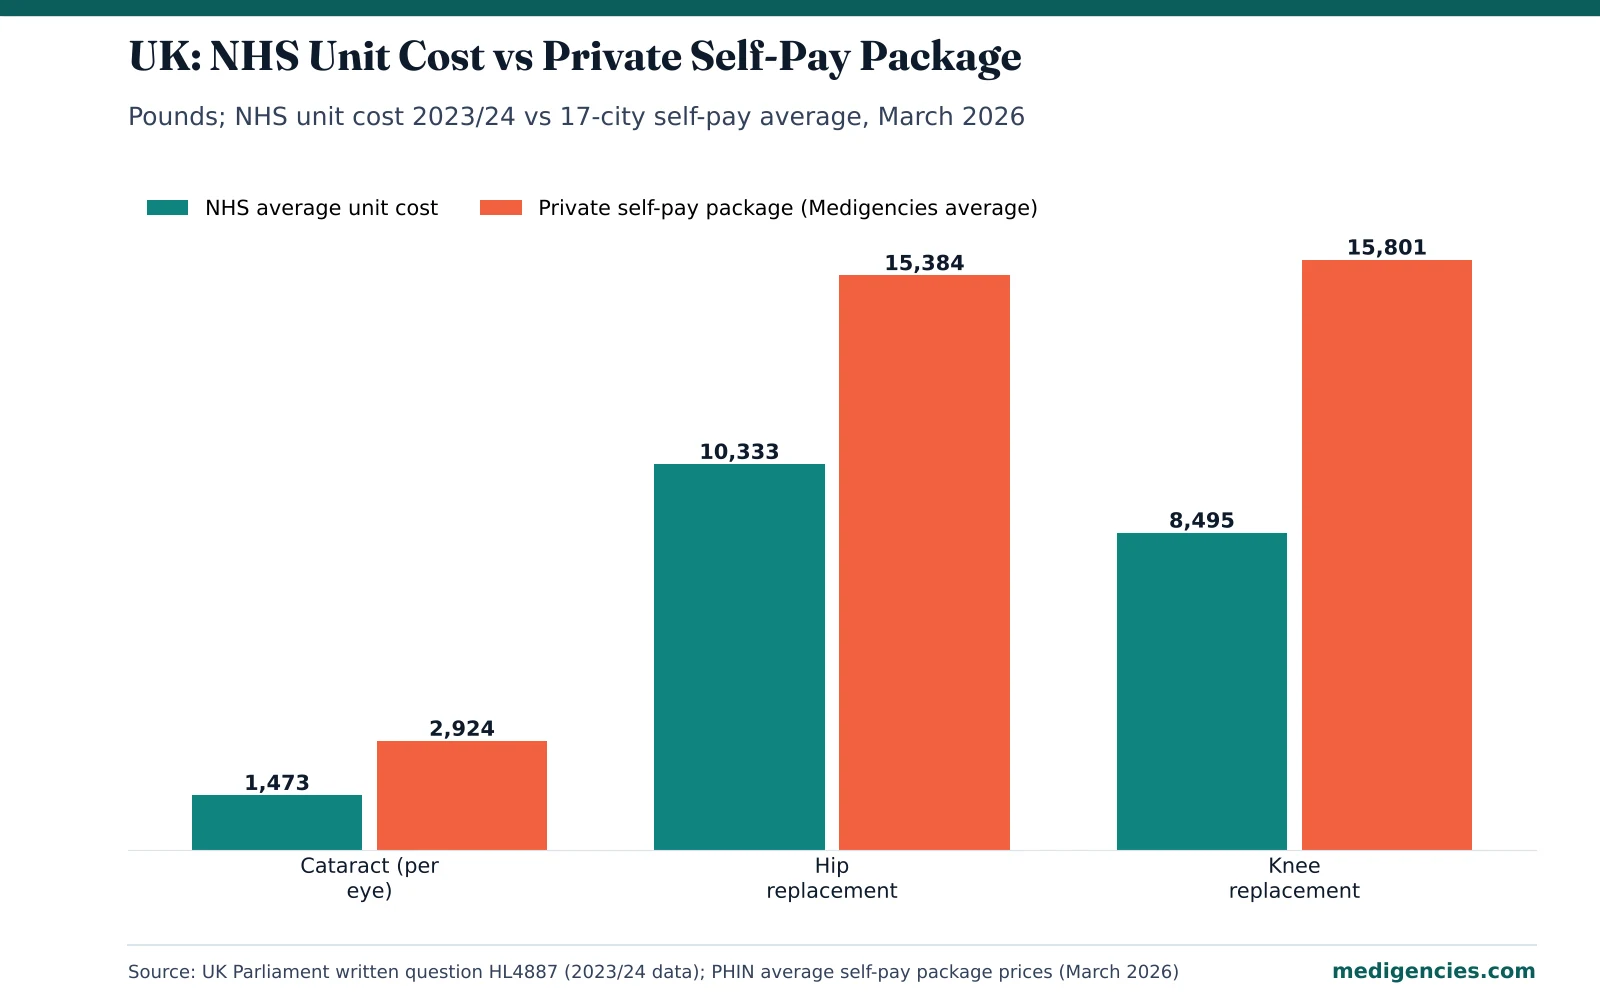
In 2023/24 the NHS carried out 120,172 hip replacements at an average unit cost of £10,333. It did 86,781 knee replacements at £8,495 each and 246,995 cataract operations at £1,473 each. Together these three groups cost the NHS about £2.34 billion, counting a separate group of complex hip or knee cases.
| Procedure | NHS average unit cost (2023/24) | Private self-pay package, 17-city average (March 2026) | Gap | Multiple |
|---|---|---|---|---|
| Cataract surgery (per eye) | £1,473 | £2,924 | £1,451 | 1.99x |
| Hip replacement | £10,333 | £15,384 | £5,051 | 1.49x |
| Knee replacement | £8,495 | £15,801 | £7,305 | 1.86x |
City-by-City Self-Pay Prices
Private prices vary less than you might expect. Hip packages ran from £13,847 in Glasgow to £17,540 in Cambridge. Knee packages ran from £14,341 in Glasgow to £18,236 in Cambridge. Cataract packages ran from £2,522 in Sheffield to £3,417 in Cardiff. London sat close to the middle, at £15,712 for a hip.
NHS trusts also sell private care. For instance, one NHS trust, Wrightington, Wigan and Leigh, sells self-pay packages. For 2023-24 it listed a standard hip at £10,000 and a standard knee at £10,500. Its robotic hip package was £12,500. We found the 17-city private hip average about 1.54 times that NHS trust price.
Medigencies takeaway: UK self-pay patients compare packages, so price pages decide the sale. Private hospitals should state the full package price and list what it excludes, such as the first consultation and physiotherapy. NHS private patient units can compete on price, and they should say so clearly. Also, pair the price with the next available date, since a shorter wait is part of what the patient buys.
Private-to-Public Cost Multiples Across Three Countries
We put every private-to-public multiple we worked out in one table. Each row uses a different measure, so compare within a row only.
| Country | Measure | Public figure | Private figure | Private-to-public multiple |
|---|---|---|---|---|
| India | Median paid out of pocket per stay (80th round) | ₹1,100 | ₹24,000 | 21.8x |
| India | Average paid out of pocket per stay (80th round) | ₹6,631 | ₹50,508 | 7.62x |
| India | Average medical spend per stay (75th round) | ₹4,452 | ₹31,845 | 7.15x |
| UK | Cataract: NHS unit cost vs self-pay package | £1,473 | £2,924 | 1.99x |
| UK | Knee: NHS unit cost vs self-pay package | £8,495 | £15,801 | 1.86x |
| UK | Hip: NHS unit cost vs self-pay package | £10,333 | £15,384 | 1.49x |
| US | Expense per adjusted day: government vs nonprofit | $3,089 | $3,449 | 1.12x |
| US | Expense per adjusted day: government vs for-profit | $3,089 | $2,623 | 0.85x |
India shows the widest gap, because government care there is close to free at the point of use. The UK gap is smaller, since NHS unit costs reflect real spending. In the US, ownership barely tracks price. A for-profit hospital spends less per day than a public one but may charge the highest list prices.
What These Cost Gaps Mean for Hospital Marketers
Cost is the first thing many patients check. So these gaps decide which price pages a hospital should build first. These are our recommendations for each market.
US Nonprofit and Government Hospitals
First, build cash-price and estimate pages for shoppable services, such as imaging and joint replacement. Next, link the financial assistance policy on each one. The MRI data shows nonprofits are often paid more for the same scan. As a result, price-sensitive patients may drift to cheaper sites. If the system owns an outpatient imaging center, promote it on the hospital’s imaging pages. Our healthcare marketing ROI statistics show how to judge whether that spend pays back.
US For-Profit Hospitals
For-profit chains post the highest list-price markups. However, their cost per day is the lowest. That gives them room to publish competitive self-pay bundles. They should state the bundle price, what it covers and how to book. For paid search, follow Google’s health rules on healthcare PPC advertising and keep health conditions out of remarketing lists.
Private Hospitals in India
Private hospitals in India should lead with package prices. A caesarean package page with the room type, stay length and exclusions answers the real question. Also, list the insurers and government schemes accepted near the top. Before you design these pages for phones, read our healthcare mobile search statistics.
Private Hospitals and NHS Private Units in the UK
UK self-pay pages should show the package price, the exclusions and the next available date. PHIN publishes city prices for hip, knee and cataract surgery, so patients already compare these three procedures. Our SEO guide for cataract surgery centers covers how to structure those procedure pages. For joint replacement campaigns, the orthopedic marketing agencies we list have published healthcare work.
Messages to Avoid on Price Pages
Do not claim that a hospital is “the cheapest” without a dated comparison. Also, avoid comparing your price to a named competitor’s. Instead, state your own price, the date it applies to and what it includes. Reviews that mention billing need careful replies. Our healthcare reputation management agencies page lists firms that handle this work.
Need help with price pages? Compare our hospital and health system marketing agencies or our healthcare content marketing agencies. You can also get matched with an agency that has hospital clients. For paid search benchmarks, see our healthcare PPC statistics.
Patients’ Questions About Private and Public Hospital Prices
Are Private Hospitals More Expensive Than Public Hospitals?
In India and the UK, yes. A private stay in India costs 7.6 times a government stay on average, out of pocket. In the UK, private self-pay packages run 1.5 to 2 times NHS unit costs. In the US, it depends on the measure, because most private hospitals are nonprofits.
Do Nonprofit Hospitals Charge Less Than For-Profit Hospitals?
Not always. For-profit hospitals have the highest list-price markups. But for a brain MRI, nonprofits were paid $387 more than for-profits in the same region. Nonprofits also spent more per inpatient day in 2024, at $3,449 against $2,623.
How Much Does a Private Hip Replacement Cost in the UK?
The average self-pay package across 17 UK cities is £15,384, using March 2026 prices. City averages ranged from £13,847 in Glasgow to £17,540 in Cambridge. Packages usually cover the surgeon, anaesthetist and hospital fees.
How Much Does a Government Hospital Stay Cost in India?
The average paid out of pocket was ₹6,631 per stay in the latest NSS round, the 80th. The median was much lower, at ₹1,100. In the 75th round, the average bill was ₹4,452.
Which US Hospitals Give the Most Charity Care?
Government hospitals gave the most in 2018, at $4.1 per $100 of expenses. For-profit hospitals followed at $3.8. Nonprofits gave $2.3.
Cost Reports, Surveys and Price Files Behind These Figures
- KFF State Health Facts, Hospital Expenses per Adjusted Inpatient Day by Ownership Type (AHA Annual Survey data, 2009 to 2024)
- American Hospital Association, Fast Facts on US Hospitals, 2026 edition (2024 survey data)
- RAND, Prices Paid to Hospitals by Private Health Plans, Round 5.1 (December 2024, 2020 to 2022 claims)
- Becker’s Hospital Review on Bai and Anderson, Health Affairs (June 2015), hospital markups in 2012 Medicare cost reports
- AuntMinnie on Jiang et al., JAMA Network Open (March 2023), brain MRI prices by hospital ownership
- Bai et al., Health Affairs (April 2021), charity care in government, nonprofit and for-profit hospitals, 2018 data
- KFF, Half of All Hospitals Have Charity Care Costs of 1.4% or Less of Operating Expenses (November 2022, 2020 data)
- Ministry of Statistics and Programme Implementation, NSS 75th Round Key Indicators of Social Consumption in India: Health (November 2019)
- ThePrint on the NSS 80th Round Household Social Consumption: Health survey (April 2026)
- Down To Earth on NSS 80th round hospital stay costs (May 2026)
- Counterview on NSS 80th round median out of pocket costs (April 2026)
- UK Parliament written question HL4887, NHS costs of hip, knee and cataract surgery (2023/24 data)
- Private Healthcare Information Network, Average Self-Pay Package Prices (March 2026 data)
- Wrightington, Wigan and Leigh NHS trust, Self Pay Fixed Packages 2023-24
Compare Agencies for This Topic
Ophthalmology and Optometry Marketing AgenciesOrthopedic Marketing AgenciesWomen's Health and OB-GYN Marketing AgenciesHealthcare Content Marketing AgenciesHealthcare PPC AgenciesHealthcare SEO Agencies
More From the Blog

Statistics
Chiropractic Treatment Usage Statistics
How many people see a chiropractor, who goes, why and how often, with BLS, Medicare and international figures plus our own patients-per-chiropractor model.
Nov 6, 2026
Guides
SEO for Menopause Treatment Clinics
An SEO guide for menopause clinics covering symptom keywords, HRT pages after the FDA label change, MSCP credentials, telehealth state pages, schema, Maps, links…
Nov 6, 2026
Guides
How Podiatrists Can Rank for Diabetic Foot Care
A podiatry SEO guide for diabetic foot care covering patient searches, ulcer, neuropathy and Medicare shoe pages, referrals, Maps, schema, diabetes educator links and…
Nov 6, 2026