
About 11% of US adults saw a chiropractor in 2022. That is up from 7.4% in 2002, in the National Health Interview Survey run by the CDC. By our math, it works out to roughly 28.7 million adults in a single year. Also, 85.7% of those adults used chiropractic care to treat or manage pain.
We compiled these chiropractic treatment usage statistics from federal surveys, Gallup polls and BLS job data. We also used HHS audits and national registers in the UK, Australia and Canada. Then we ran our own numbers in Python. So you get growth rates, group gaps, a patients-per-chiropractor model and a four-country headcount comparison. After each set of figures, we explain what it means for chiropractic clinics and the people who market them.
Eleven Chiropractic Use Figures Clinic Owners Ask About
- 11.0% of US adults saw a chiropractor in 2022, against 7.4% in 2002. By our math, that is a 49% rise in the share.
- 85.7% of adults who saw a chiropractor in 2022 did so for pain.
- In 2017, 11.1% of women and 9.4% of men saw a chiropractor. Adults aged 45 to 64 led at 11.4%.
- Only 3.4% of children aged 4 to 17 saw one in 2017. Teens aged 12 to 17 used it at 2.4 times the rate of younger kids.
- Recent chiropractic patients averaged 11 visits a year in Gallup’s 2015 poll for Palmer College.
- The US had 61,700 chiropractor jobs in the latest BLS count. Median pay was $79,200 a year.
- BLS projects 9% job growth for chiropractors over the ten years to 2035.
- HHS auditors put 82% of Medicare chiropractic payments in 2013, or $358.8 million, outside Medicare rules.
- The Medicare improper payment rate for chiropractic fell from over 54% in 2014 to just over 31% in 2022.
- Australia has about 25 chiropractors per 100,000 people. The UK has under 6, by our math.
- Our model gives each US chiropractor roughly 465 adult patients and about 5,100 visits a year.
One in Nine US Adults Now Sees a Chiropractor in a Year
11.0% of US adults saw or talked to a chiropractor in 2022. In 2002, the share was 7.4%. These figures come from a 2024 research letter in JAMA by NIH researchers Richard Nahin, Alexandra Rhee and Barbara Stussman. They used the National Health Interview Survey for both years.
We ran the change ourselves. The share rose 3.6 percentage points, so the rate is about 49% higher than in 2002. Next, we applied 11.0% to the Census Bureau’s estimate of 260.8 million US adults in mid-2022. That gives roughly 28.7 million adult chiropractic patients in one year.
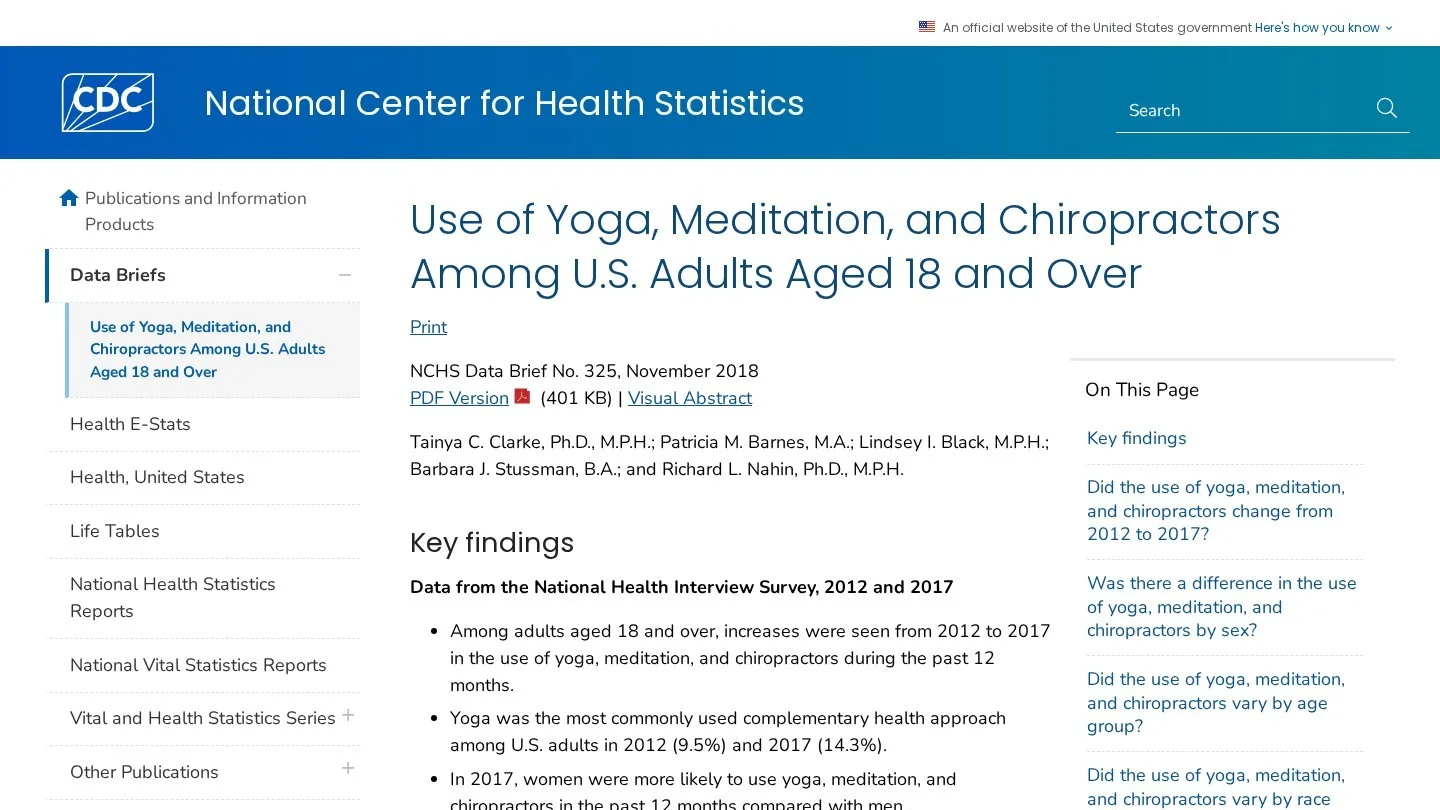
A middle data point exists too. NCHS Data Brief No. 325, from November 2018, put adult use at 9.1% in 2012 and 10.3% in 2017. Still, the 2012 survey asked about spinal manipulation, so its wording differs from the other years. For that reason, we compare 2002 and 2022 directly and treat 2012 with care.
| Survey year | US adults who saw a chiropractor | Question asked |
|---|---|---|
| 2002 | 7.4% | Saw a practitioner for chiropractic care |
| 2012 | 9.1% | Wording centred on spinal manipulation |
| 2017 | 10.3% | Saw a chiropractor |
| 2022 | 11.0% | Saw or talked to a chiropractor |
For clinics: A market growing by about half in 20 years still leaves 89% of adults who did not visit. So most of your future patients have never sat on a chiropractic table. That is why first-visit pages, plain price notes and “what to expect” videos earn their place on a clinic site.
Adult Use by Sex, Age and Background
Women were more likely to see a chiropractor than men in 2017, at 11.1% against 9.4%. By age, adults 45 to 64 led at 11.4%. Adults 18 to 44 came next at 9.9%, then adults 65 and older at 9.5%.
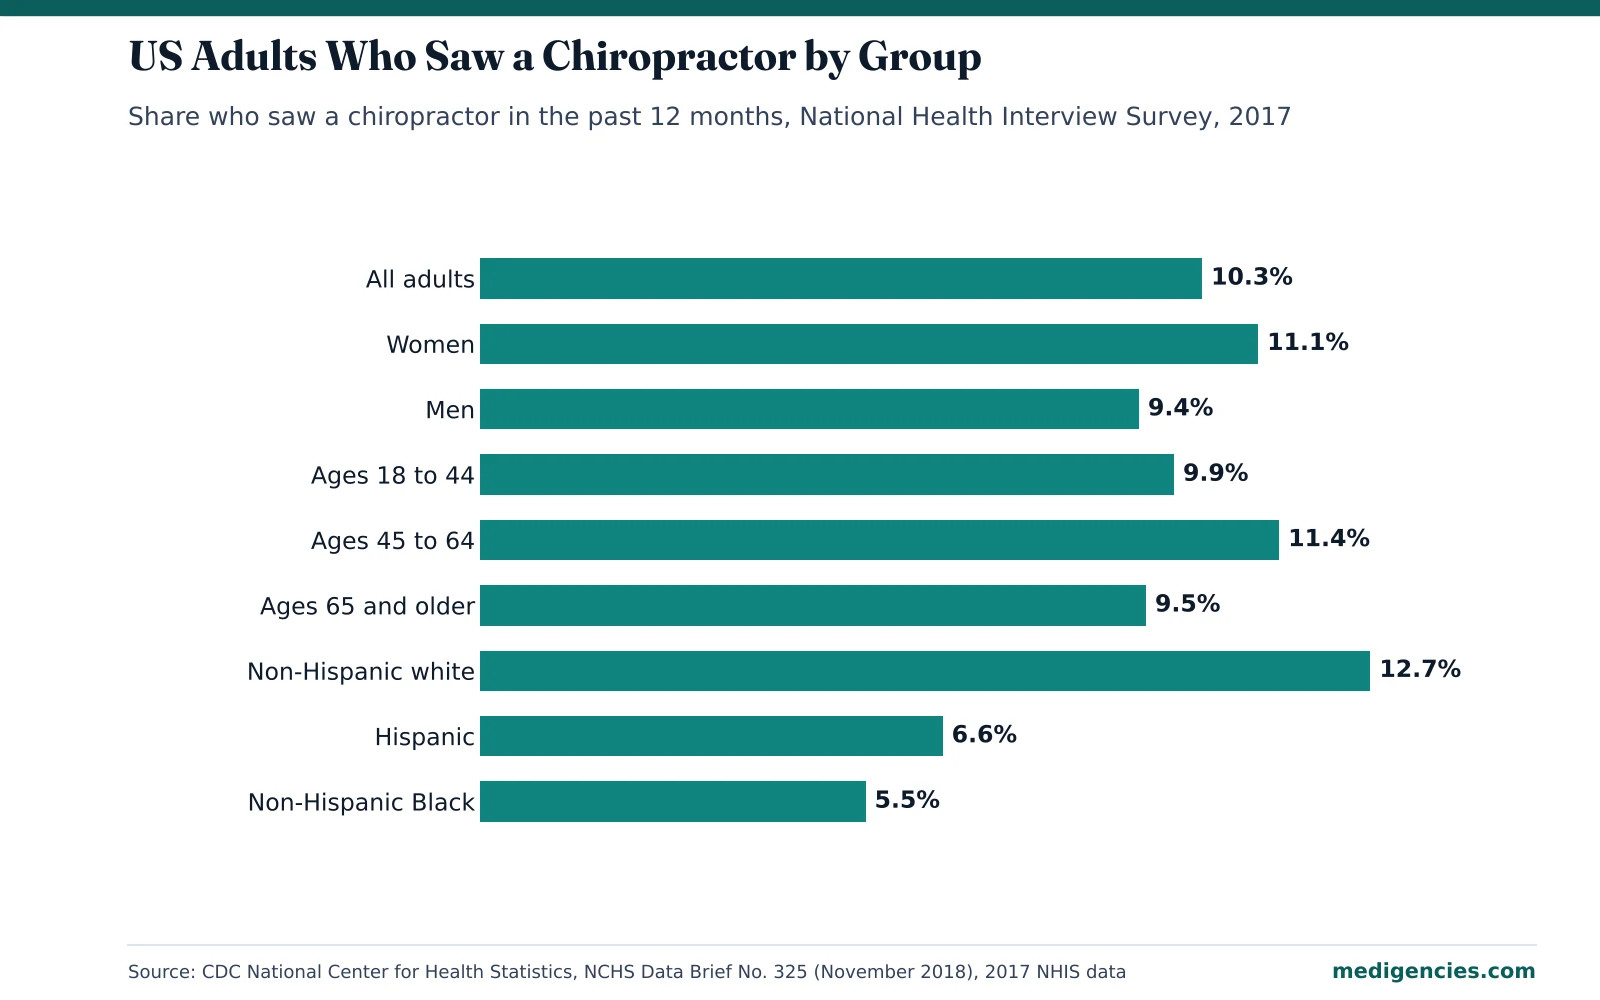
The gap by race and ethnicity is wider. Non-Hispanic white adults used chiropractors at 12.7%. However, the rate was 6.6% for Hispanic adults and 5.5% for non-Hispanic Black adults. By our math, white adults saw a chiropractor at 2.3 times the rate of Black adults and 1.9 times the rate of Hispanic adults.
For clinics: Women aged 45 to 64 sit in both of the highest-use groups. So their concerns, such as desk-job neck pain or back pain while caring for parents, make a natural first content series. On the other hand, the low rates among Hispanic and Black adults point to a reach gap. Spanish-language pages and community health fairs speak to people who may never have been offered chiropractic care.
Children and Teens Who See a Chiropractor
3.4% of US children aged 4 to 17 saw a chiropractor in 2017. In 2012, the share was 3.5%, and the change was not statistically significant in NCHS Data Brief No. 324. So child use held flat while adult use rose.
Age splits the child figure sharply. Teens aged 12 to 17 used chiropractors at 5.1%, against 2.1% for ages 4 to 11. In fact, that is 2.4 times the rate, by our math. Non-Hispanic white children were at 5.1%, while Hispanic children were at 1.4% and non-Hispanic Black children at 1.0%.
For clinics: The teen jump lines up with school sports. So pediatric content works best when it speaks to parents of athletes about sports injuries and posture. Even so, keep claims modest. Child health is an area where state boards and ad platforms look closely at what clinics promise.
Pain Is the Reason Behind 86% of Chiropractic Use
85.7% of adults who saw a chiropractor in 2022 did so to treat or manage pain. That was the highest pain-use share of any complementary approach in the JAMA study. For comparison, 49.2% of people using any of the approaches studied used them for pain in 2022, up from 42.3% in 2002.
We multiplied the two NHIS shares to size the pain group. Then 11.0% of adults times 85.7% gives about 9.4% of all US adults. Applied to 260.8 million adults, that is roughly 24.6 million people who saw a chiropractor for pain in 2022.
Back and neck pain is common, too. In Gallup’s 2018 report for Palmer College, 62% of adults had seen a health professional for neck or back pain at some point. Also, 25% had done so in the past 12 months.
For clinics: Patients search for the problem first and the provider second. So condition pages for low back pain, sciatica, neck pain and headaches carry more search demand than a page about adjustments alone. Our chiropractor SEO guide shows how to build those condition pages and tie them to each clinic location.
Gallup and Palmer College Polls on Chiropractic Patients
Palmer College of Chiropractic paid Gallup to survey US adults in 2015, 2017 and 2018. Because a chiropractic college funded the work, we treat these as sponsored polls. Still, Gallup ran large samples of 5,000 to 6,300 adults, so the figures are useful for patient attitudes.
How Often Patients Go and Who They Choose First
14% of US adults had seen a chiropractor in the past 12 months in the 2015 Gallup poll. That equals about 33.5 million adults. Recent patients averaged 11 visits in the year. Then another 12% had gone within five years but not in the past year.
The past-year share was 18% in the 2017 poll and 16% in the 2018 poll. These are higher than the NHIS figures. The reason is likely method. Gallup used a web and mail panel, while NHIS uses in-person federal interviews with different wording.
| Poll year | Adults surveyed | Saw a chiropractor in past 12 months | Other headline figure |
|---|---|---|---|
| 2015 | 5,442 | 14% | Average of 11 visits a year among recent patients |
| 2017 | 6,305 | 18% | 78% prefer other options before prescription pain drugs |
| 2018 | 5,377 | 16% | 53% of adults treated for neck or back pain saw a chiropractor |
First choice is a different story. In 2015, 54% of adults said they would go to a medical doctor first for neck or back pain. However, 29% would go to a chiropractor first. Physical therapists, massage therapists and acupuncturists each drew under 10%.
Even so, many people end up at a chiropractor. In 2018, 53% of adults who saw any provider for neck or back pain in the past year saw a chiropractor. Also, 74% of chiropractic patients said someone recommended chiropractic care before their first visit. The average age at a first visit was 30.
For clinics: Three in four patients arrive on a recommendation. So referral asks, review requests and a referral card for happy patients matter as much as ads. Then, when the friend searches your name, your Google profile and reviews do the closing. Our list of healthcare reputation management agencies covers firms that run review programs for clinics.
How Patients Rate Their Chiropractor
In 2015, 61% of adults agreed that chiropractic works for neck and back pain. Then in 2017, 81% said chiropractic helps back and neck pain “a great deal” or “some.” Patients rated care highly, too. In the 2018 poll, 93% said their chiropractor often listens, and 93% said they often get quick, convenient access.
Patients gave clear reasons for choosing a chiropractor. In 2018, 54% said it was the safest option with the fewest side effects. Also, 53% cited trust and 52% said it was the most effective treatment. Only 21% named insurance coverage, and 12% said it cost less.
For clinics: Safety and trust beat price as reasons to choose. So lead your service pages with the doctor’s training, how a first visit works and what you check before any adjustment. Discount offers can come later in the funnel.
Industry Figures From the ACA and F4CP
The American Chiropractic Association (ACA) is the profession’s main US trade group. The Foundation for Chiropractic Progress (F4CP) is a nonprofit that promotes chiropractic care. So we label their figures as industry numbers, and we show where each one comes from.
The ACA says about 70,000 chiropractors practise in the US, citing a federal HRSA workforce report. It also says roughly 11,000 students attend 19 accredited US programs, and about 2,800 new chiropractors enter the workforce each year. Programs need at least 4,200 hours of class, lab and clinical work. The ACA also says chiropractors treat more than 35 million Americans a year, adults and children, citing Gallup.
F4CP paid The Harris Poll to survey 2,095 US adults in August 2024. In that poll, 82% had had back or neck pain at some point. Among adults with that pain, 31% saw a chiropractor, and 80% of them rated it effective. Next, 39% saw a medical doctor or physician assistant. Among those referred elsewhere by that doctor, a chiropractor was the most common referral, at 21%.
A 2023 Harris Poll for F4CP looked at low back pain. On average, 25% of adults chose a chiropractor for it, while 40% chose a primary care doctor. Choice varied by group. For example, 29% of people earning $100,000 or more visited a chiropractor, against 19% of those earning $50,000 or less. The Midwest led at 28%, while the Northeast trailed at 21%.
| Industry figure | Value | Published by |
|---|---|---|
| Chiropractors practising in the US | About 70,000 | ACA, citing HRSA |
| Chiropractic students in US programs | About 11,000 in 19 programs | ACA |
| New chiropractors entering practice each year | About 2,800 | ACA |
| Americans treated each year | More than 35 million | ACA, citing Gallup |
| Adults with back or neck pain who saw a chiropractor | 31% | F4CP and Harris Poll, 2024 |
| Chiropractic patients rating care effective | 80% | F4CP and Harris Poll, 2024 |
| Adults choosing a chiropractor for low back pain | 25% | F4CP and Harris Poll, 2023 |
For clinics: The income and region gaps tell you where demand already sits. A Midwest clinic in a higher-income suburb faces a warmer market than a clinic in a lower-income Northeast town. As a result, the second clinic needs more education content and clearer cash-pay pricing before ads pay off. Our chiropractor PPC strategies cover radius, offers and condition ad groups for both cases.
Chiropractor Jobs and Pay in the BLS Outlook
The US had 61,700 chiropractor jobs in the latest Occupational Outlook Handbook count. Median pay was $79,200 a year, or $38.08 an hour. The lowest 10% earned under $43,460, and the top 10% earned over $146,080. By our math, the top tenth earns about 3.4 times the bottom tenth.
BLS projects 9% job growth for chiropractors over the ten years to 2035. That is much faster than the average for all jobs. It means about 5,300 new jobs and about 2,600 openings a year, once retirements and job changes are counted.
Most chiropractors work in small offices. In fact, 57% work in offices of chiropractors and 36% are self-employed. Median pay in chiropractic offices was $78,460.
For clinics: About 2,600 openings a year against about 2,800 new graduates means most new doctors find a seat. But it also means a steady stream of new clinics in each metro. So a clinic that waits to build its local search presence will compete with more names every year. Our list of chiropractic SEO agencies covers firms that work only or mostly with chiropractors.
States With the Most Chiropractors on Payroll
The BLS wage survey counts only employees, so it leaves out self-employed owners. In May 2023, it counted 41,480 chiropractor employees. Their mean pay was $89,760, and their median was $76,530.
| State | Chiropractor employees | Mean annual wage |
|---|---|---|
| Texas | 3,420 | $94,040 |
| California | 3,410 | Not released |
| Florida | 3,360 | $85,380 |
| New York | 3,330 | $93,540 |
| Illinois | 2,590 | $69,480 |
Density tells another story. North Dakota had 0.61 chiropractor jobs per 1,000 jobs, the highest of any state. Nebraska and Iowa followed at 0.60 each. Meanwhile, Alaska paid the highest mean wage, at $134,020.
For clinics: In the high-density Plains states, many patients already know a chiropractor. So the fight there is for reviews and loyalty more than awareness. In Texas, Florida and New York, the sheer number of clinics makes map pack rank the main battle.
Medicare Chiropractic Payments and HHS Audit Results
Medicare paid $438.1 million for chiropractic services in 2013. An HHS Office of Inspector General audit, report A-09-14-02033, estimated that about 82% of that, or $358.8 million, did not meet Medicare rules. Many claims were for care beyond what Medicare treats as medically needed.

A second OIG review, OEI-01-14-00200, flagged $76 million in questionable 2013 payments. Almost half of that came from claims that suggested maintenance therapy, which Medicare does not cover. In fact, just 2% of chiropractors drew half of the questionable payments. A separate OIG audit of one Queens practice notes that Medicare allowed about $1.4 billion for chiropractic across 2012 and 2013 combined.
Documentation has improved since then. The ACA cites CMS improper payment data on this. It says the chiropractic error rate fell from over 54% in 2014 to just over 31% in 2022. By our math, that is a 43% cut in the rate. Even so, 31% is still high for any Medicare service.
| Medicare measure | Figure | Period |
|---|---|---|
| Medicare payments for chiropractic services | $438.1 million | 2013 |
| Share that did not meet Medicare rules | About 82% ($358.8 million) | 2013 |
| Questionable payments flagged | $76 million | 2013 |
| Chiropractors behind half of questionable payments | 2% | 2013 |
| Chiropractic improper payment rate | Over 54% | 2014 |
| Chiropractic improper payment rate | Just over 31% | 2022 |
For clinics: Medicare patients bring audit risk along with revenue. So any page aimed at seniors should say plainly what Medicare covers and what it does not. Avoid “unlimited care plans” or wellness promises on Medicare pages. Then train front-desk staff to explain the difference between active treatment and maintenance care before the first bill.

Chiropractors in the UK, Australia and Canada
The UK had 3,875 chiropractors on the General Chiropractic Council register at 31 December 2024. In that year, 284 new registrants joined, 3% fewer than the year before. Registrants were split about 48% male and 48% female, with 4% not stating. The largest age band was 25 to 29, with 580 chiropractors.
Australia had 6,936 registered chiropractors in the year to June 2026. That was up 2.5% on the year before, in the Chiropractic Board of Australia’s annual summary. Chiropractors made up 0.7% of all registered health practitioners, and 58% were male. Also, 307 chiropractors registered for the first time.
Private health insurance pays for many Australian visits. In the March 2024 quarter, the average insurer benefit per chiropractic service was A$36.01, and insurers paid A$86.6 million in chiropractic benefits. For comparison, the benefit per physiotherapy service was A$42.31. By our math, that is 17% more than the chiropractic benefit.
The Canadian Chiropractic Association says about 9,000 licensed chiropractors practise in Canada. It also says about 4.7 million Canadians see a chiropractor each year. These are industry figures on an older association page. Still, applied to Canada’s 41.7 million people, 4.7 million is about 11% of the population.
Chiropractors per 100,000 People in Four Countries
We divided each country’s chiropractor count by its latest official population estimate. Australia came out on top at 24.8 chiropractors per 100,000 people. Canada followed at 21.6, then the US at 18.1. The UK sat far behind at 5.6.
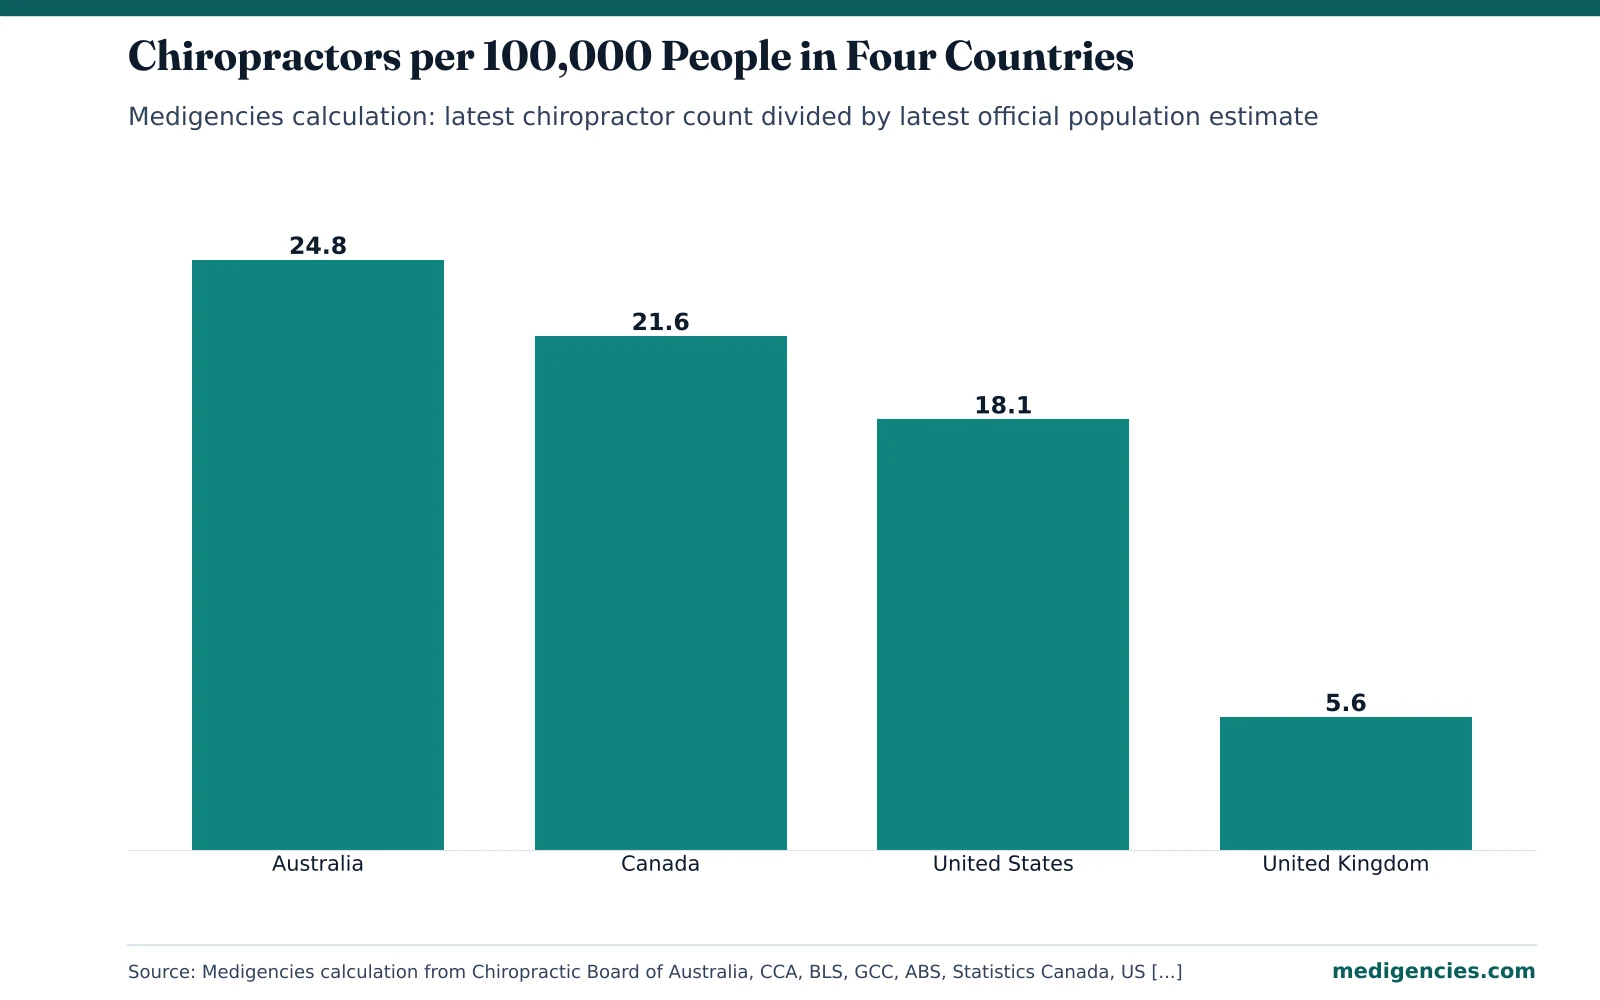
| Country | Chiropractors | Population used | Per 100,000 people | People per chiropractor |
|---|---|---|---|---|
| Australia | 6,936 | 27.9 million | 24.8 | About 4,030 |
| Canada | About 9,000 | 41.7 million | 21.6 | About 4,630 |
| United States | 61,700 jobs | 341.8 million | 18.1 | About 5,540 |
| United Kingdom | 3,875 | 69.3 million | 5.6 | About 17,880 |
The counts differ in type. Australia and the UK count registrants, Canada counts licensed chiropractors, and the US figure counts jobs. If we use the ACA’s 70,000 instead, the US rises to 20.5 per 100,000. Even then, it stays behind Australia and Canada.
For agencies: A UK clinic serves about three times as many people per chiropractor as a US clinic. So UK marketing leans on awareness, while US and Australian clinics face crowded local search results. If your agency works across borders, set different cost-per-patient targets for each market.
Our Patients-per-Chiropractor Model for the US
We built a rough model of one US chiropractor’s yearly caseload. First, we took our estimate of 28.7 million adult patients in 2022. Next, we divided by the 61,700 chiropractor jobs in the latest BLS count. That gives about 465 adult patients per chiropractor a year.
Then we applied Gallup’s 2015 average of 11 visits per patient. That works out to about 5,100 adult visits per chiropractor a year. Over 48 working weeks, it is roughly 107 adult visits a week. The model mixes survey years, so treat it as a planning range, and it leaves out children.
| Step | Input | Result |
|---|---|---|
| 1. Adult patients a year | 11.0% x 260.8 million adults (2022) | About 28.7 million |
| 2. Patients per chiropractor | 28.7 million / 61,700 jobs | About 465 |
| 3. Visits per chiropractor a year | 465 x 11 visits (Gallup, 2015) | About 5,100 |
| 4. Visits per working week | 5,100 / 48 weeks | About 107 |
| 5. Pain patients per chiropractor | 465 x 85.7% | About 400 |
For clinics: Use the model to set a new-patient target. Say a typical patient stays for 11 visits. Then a doctor with 107 visits a week needs about 10 new patients a week to stay full. That number tells you how many booked calls your website and ads must produce. Our healthcare PPC statistics give cost benchmarks to price those calls.
What the Usage Data Means for Chiropractic Marketing
Pain is the reason for nearly nine in ten visits. So the first job of any chiropractic website is to rank for pain conditions in its town. Next, it should explain the first visit, the cost and the doctor’s training in plain words.
Recommendations bring three in four new patients. As a result, reviews and referral programs carry more weight here than in many specialties. Our chiropractor social media marketing ideas include ways to share patient stories with written consent and without breaking privacy rules.
Many pain searches happen on a phone, often on the day the pain starts. So condition pages and booking forms must load fast and work well on a small screen. Our healthcare mobile search statistics cover speed limits and mobile habits by age.
Finally, compliance shapes the message. Medicare audits, state board rules and Google’s health ad policies all limit what a clinic can promise. Want a specialist to handle it? Our directory of chiropractic marketing agencies lists firms with public chiropractic case work. Also, our chiropractic PPC agencies page covers paid search teams.
Questions About How Many People Use Chiropractic Care
What Percentage of Americans See a Chiropractor?
11.0% of US adults saw or talked to a chiropractor in 2022, in the National Health Interview Survey. By our math, that is about 28.7 million adults. Gallup polls for Palmer College put the yearly share higher, from 14% to 18%.
Is Chiropractic Use Going Up?
Yes. Adult use rose from 7.4% in 2002 to 11.0% in 2022. That is about a 49% rise in the share. However, child use held flat at about 3.5% between 2012 and 2017.
Who Uses Chiropractors the Most?
In 2017, adults aged 45 to 64 had the highest rate, at 11.4%. Women used chiropractors more than men, at 11.1% against 9.4%. Non-Hispanic white adults had the highest rate by race and ethnicity, at 12.7%.
How Many Times a Year Do Patients Visit a Chiropractor?
Recent patients averaged 11 visits in a year in Gallup’s 2015 poll for Palmer College. That average covers everyone from one-time visitors to people in long care plans.
How Many Chiropractors Are There in the US?
BLS counted 61,700 chiropractor jobs in its latest outlook. The ACA, citing a federal HRSA report, says about 70,000 chiropractors practise. The gap comes from how each source counts owners and part-time work.
Does Medicare Pay for Chiropractic Care?
Medicare paid $438.1 million for chiropractic services in 2013. But it does not cover maintenance therapy. HHS auditors estimated that about 82% of the 2013 payments did not meet Medicare rules.
Surveys, Audits and Registers Behind These Chiropractic Figures
- NCCIH, Use of Complementary Health Approaches: 20-Year Trends (NHIS 2002 and 2022)
- NCCIH, Use of Complementary Health Approaches for Pain by U.S. Adults Increased From 2002 to 2022 (January 2024)
- Nahin, Rhee and Stussman, Use of Complementary Health Approaches Overall and for Pain Management by US Adults, JAMA (2024), abstract
- Clarke and others, Use of Yoga, Meditation, and Chiropractors Among U.S. Adults Aged 18 and Over, NCHS Data Brief No. 325 (November 2018)
- Use of Yoga, Meditation, and Chiropractors Among U.S. Children Aged 4 to 17 Years, NCHS Data Brief No. 324 (November 2018)
- US Census Bureau, Estimates of the Voting Age Population for 2022, Federal Register
- Gallup, Majority in U.S. Say Chiropractic Works for Neck, Back Pain (September 2015)
- Gallup-Palmer College of Chiropractic Annual Report (2017)
- Gallup-Palmer College of Chiropractic Annual Report: Managing Neck and Back Pain in America (2018)
- American Chiropractic Association, Key Facts and Figures About the Chiropractic Profession
- American Chiropractic Association, ACA Focus on Education Leads to Lower Medicare Documentation Error Rates (July 2023)
- F4CP, Chiropractic Intervention Is Effective Pain Relief Method, Harris Poll release (October 2024)
- F4CP, Harris Poll: Younger Americans More Likely to Adopt Chiropractic Care (August 2023)
- US Bureau of Labor Statistics, Occupational Outlook Handbook: Chiropractors
- US Bureau of Labor Statistics, Occupational Employment and Wages, May 2023: Chiropractors
- HHS OIG, Hundreds of Millions in Medicare Payments for Chiropractic Services Did Not Comply With Medicare Requirements, A-09-14-02033 (2016)
- HHS OIG, CMS Should Use Targeted Tactics To Curb Questionable and Inappropriate Payments for Chiropractic Services, OEI-01-14-00200 (2015)
- HHS OIG, A Queens Chiropractor Received Improper Medicare Payments for Chiropractic Services, A-02-15-01003 (December 2018)
- General Chiropractic Council, 2024 Registrations Annual Report
- Chiropractic Board of Australia, Annual Summary (year to June 2026)
- APRA, Quarterly Private Health Insurance Statistics, March 2024
- Canadian Chiropractic Association, Quick Facts
- Office for National Statistics, Population Estimates for the UK, Mid-2024
- Australian Bureau of Statistics, Australia’s Population Grows 1.4% in March 2026 (September 2026)
- Statistics Canada, Canada’s Population Estimates, Second Quarter (The Daily)
- US Census Bureau, Vintage National and State Population Estimates Press Kit (January 2026)
Compare Agencies for This Topic
Chiropractic Marketing AgenciesHealthcare Content Marketing AgenciesHealthcare PPC AgenciesHealthcare SEO Agencies
More From the Blog

Guides
SEO for Menopause Treatment Clinics
An SEO guide for menopause clinics covering symptom keywords, HRT pages after the FDA label change, MSCP credentials, telehealth state pages, schema, Maps, links…
Nov 6, 2026

Guides
How Podiatrists Can Rank for Diabetic Foot Care
A podiatry SEO guide for diabetic foot care covering patient searches, ulcer, neuropathy and Medicare shoe pages, referrals, Maps, schema, diabetes educator links and…
Nov 6, 2026

Statistics
Private Hospital vs Public Hospital Cost Statistics
Hospital costs by ownership in the US, India and the UK, with our own ratios, growth rates and price-page advice for hospital marketers.
Nov 5, 2026