Hospital advertising does bring in patients. A study of Medicare claims gives causal proof. When hospital TV ads in a market rose 10%, admissions rose by about 9 per 100,000 beneficiaries. On the cost side, Facebook ads recruited health research participants for a median of $14.41 each. That was about 1/76th of the $1,094.27 per participant that TV cost in one study.
We compiled these healthcare digital marketing ROI statistics from peer-reviewed studies, an NBER paper and hospital budget surveys. We also added Google’s own return claim. Then we ran our own math in Python. So you get growth rates, cost ratios, dollar splits and a click-to-patient model, with each input named. Each set of numbers ends with our take for clinics and hospital marketers.
Eight Numbers That Shape Healthcare Marketing Returns
- Ads for health services such as hospitals, dental centers and cancer centers grew from $542 million in 1997 to $2.9 billion in 2016. By our math, that is 5.35 times, or 9.2% a year.
- A 10% rise in hospital ads meant about 9 more admissions per 100,000 Medicare beneficiaries. The inpatient volume elasticity was 0.06.
- Health systems put 0.51% to 0.60% of net patient revenue into marketing in 2022. That is $5.10 to $6.00 per $1,000.
- Large healthcare companies in a Gartner survey spent 7.2% of revenue on marketing in 2024. That is 12 to 14 times the health system ratio.
- Digital took 64% of US healthcare and pharma media ad spend in 2022. The forecast for 2026 is nearly 80%.
- Facebook ads recruited research participants for a median of $14.41. A median $0.51 click and a 4% conversion rate give $12.75 per sign-up.
- Per dollar spent, social media ads had 1.97 times the odds of recruiting a participant compared with non-social methods, across 23 studies.
- Google says businesses earn $8 in profit for every $1 spent on Google Search and Ads. Free organic clicks make up $6 of that $8.
How Health Services Advertising Grew 5.35 Times in Two Decades
US medical marketing rose from $17.7 billion in 1997 to $29.9 billion in 2016. That is the total in a JAMA analysis of drug, disease awareness, health service and lab test marketing. However, the fastest growth came from providers. Health services advertising went from $542 million to $2.9 billion. Hospitals, dental centers, cancer centers, mental health and addiction centers, and home health services drove that rise.
We turned the start and end figures into growth multiples and yearly growth rates. The table shows each category over the 19 years.
| Category | 1997 | 2016 | Growth multiple | Yearly growth |
|---|---|---|---|---|
| Health services ads (hospitals, clinics, centers) | $542 million | $2.9 billion | 5.35x | 9.2% |
| Prescription drug ads to consumers | $1.3 billion | $6.0 billion | 4.62x | 8.4% |
| All consumer advertising | $2.1 billion | $9.6 billion | 4.57x | 8.3% |
| Disease awareness campaigns | $177 million | $430 million | 2.43x | 4.8% |
| Marketing to health professionals | $15.6 billion | $20.3 billion | 1.30x | 1.4% |
| Lab test ads to consumers | $75.4 million | $82.6 million | 1.10x | 0.5% |
| All medical marketing | $17.7 billion | $29.9 billion | 1.69x | 2.8% |
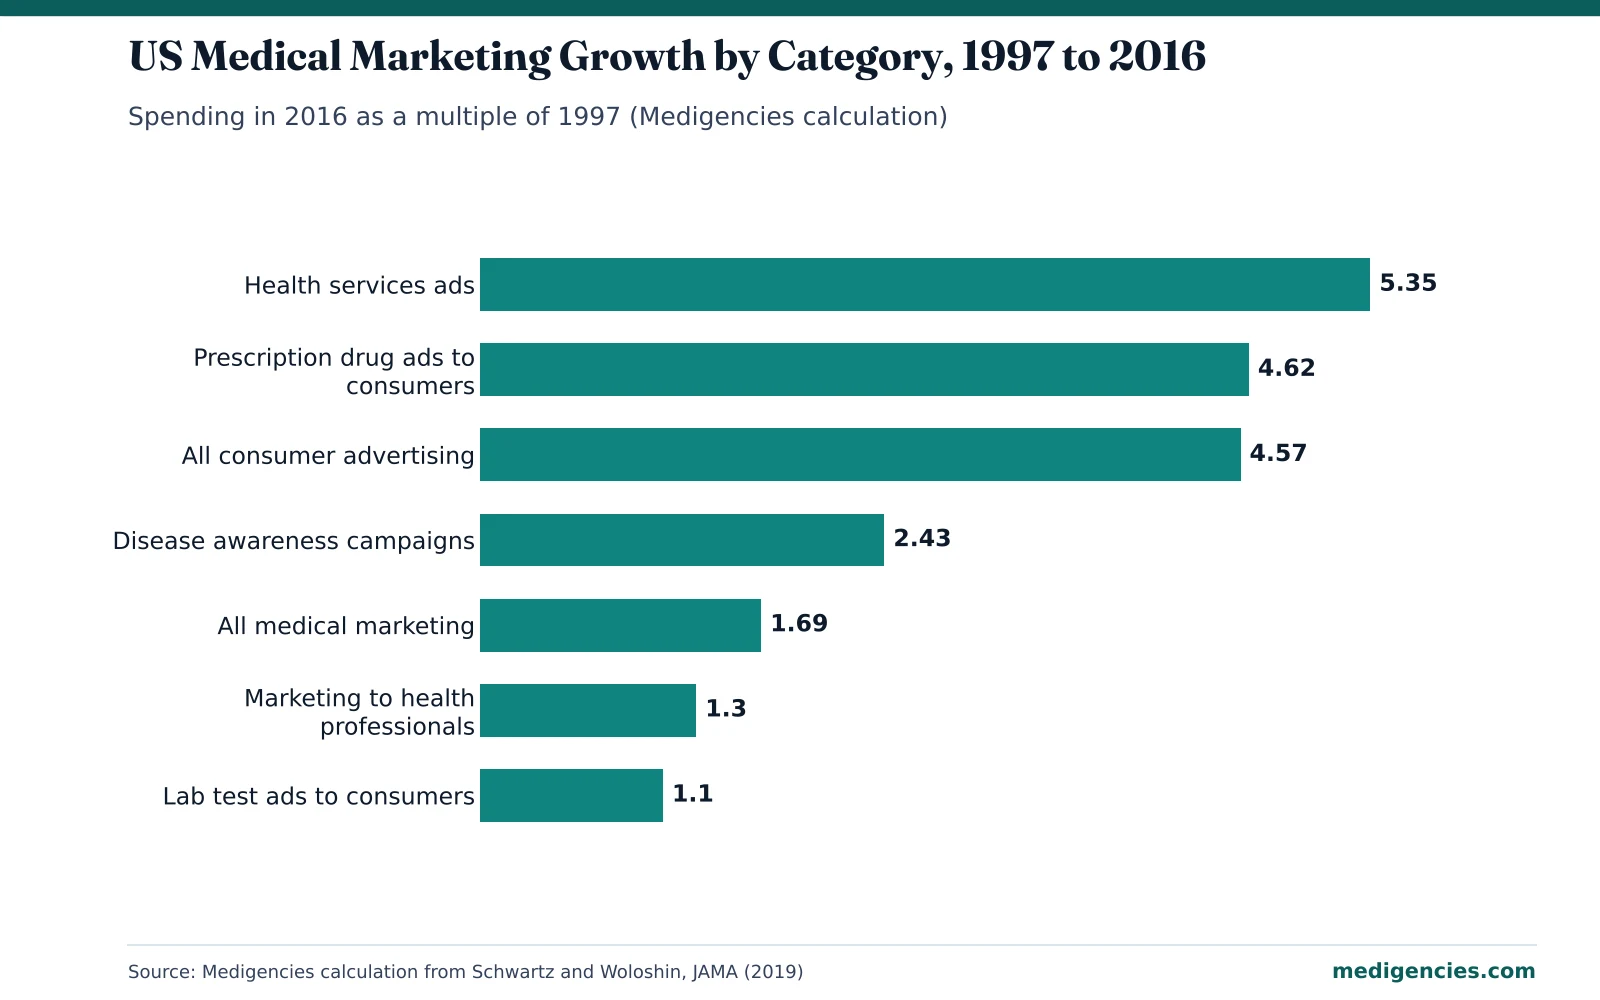
Provider ads also took a larger slice. By our math, health services made up 3.1% of all medical marketing in 1997 and 9.7% in 2016. Within consumer advertising, their share rose from 25.8% to 30.2%. Meanwhile, consumer ads overall grew from 11.9% of the total to 32%.
Our take: Providers did not raise ad budgets five-fold over two decades without seeing patients come in. Still, growth alone proves nothing about return. For that, the causal studies on hospital ads carry more weight than spend totals. For a full view of what paid search costs by specialty, our healthcare PPC statistics page covers clicks, leads and patient acquisition cost.
Digital Now Takes Most Healthcare Media Dollars
Digital channels took 64% of US healthcare and pharma media ad spending in 2022. For 2026, the eMarketer forecast is nearly 80%. So by our math, digital’s share rises about 16 points in four years, or roughly 4 points a year.
Cross-industry budgets show the same shift. In the Gartner CMO Spend Survey fielded early in 2026, digital made up more than two-thirds of total media spend. Also, 62.6% of media spend went to awareness and conversion. Loyalty and retention fell under 15%. Labor took 24.5% of marketing budgets, up from 21.9% a year earlier. That survey covered 401 marketing leaders in North America, the UK and Europe.
Our take: Retention spend is shrinking across industries. But in healthcare, a returning patient is often the cheapest one to win. For example, recall emails and portal reminders cost little, while a new-patient click can cost dollars. So keep a fixed slice of the digital budget for existing patients. Our list of healthcare content marketing agencies covers firms that build email and education programs.
What Health Systems Spend on Marketing per $1,000 of Revenue
Health systems spent 0.51% to 0.60% of net patient revenue on marketing in 2022. Those ratios are from SHSMD, the Society for Healthcare Strategy and Market Development, which is part of the American Hospital Association. In plain dollars, a system spends $5.10 to $6.00 on marketing for every $1,000 it collects from patient care.
| System type | Marketing as % of net patient revenue | In a competitive market | Marketing per $1,000 of revenue | Median marketing budget |
|---|---|---|---|---|
| Geographically narrow | 0.55% | 0.59% | $5.50 | $700,000 |
| Regional | 0.51% | 0.58% | $5.10 | $8.6 million |
| National | 0.60% | 0.60% | $6.00 | $42 million |
Competition pushes the ratio up. For instance, regional systems in competitive markets spent 0.58% against a 0.51% average. By our math, that is 14% more marketing per revenue dollar. Narrow systems in competitive markets spent about 7% more.
Large healthcare companies spend far more. In Gartner’s CMO Spend Survey, healthcare marketing budgets equaled 7.2% of revenue in 2024, down from 9.6% in 2023. That sample is mostly firms with more than $1 billion in revenue, including drug and product makers. Even so, by our math, 7.2% is 12 to 14 times the hospital ratio.
Where Each Hospital Marketing Dollar Goes
Advertising was the largest line for every system type, at 31% to 36% of the budget. Digital media and website spending came next for narrow systems, at 22%. However, it fell to 17% for regional systems and 16% for national ones. Service line and physician relations work grew with size, from 8% to 24%.
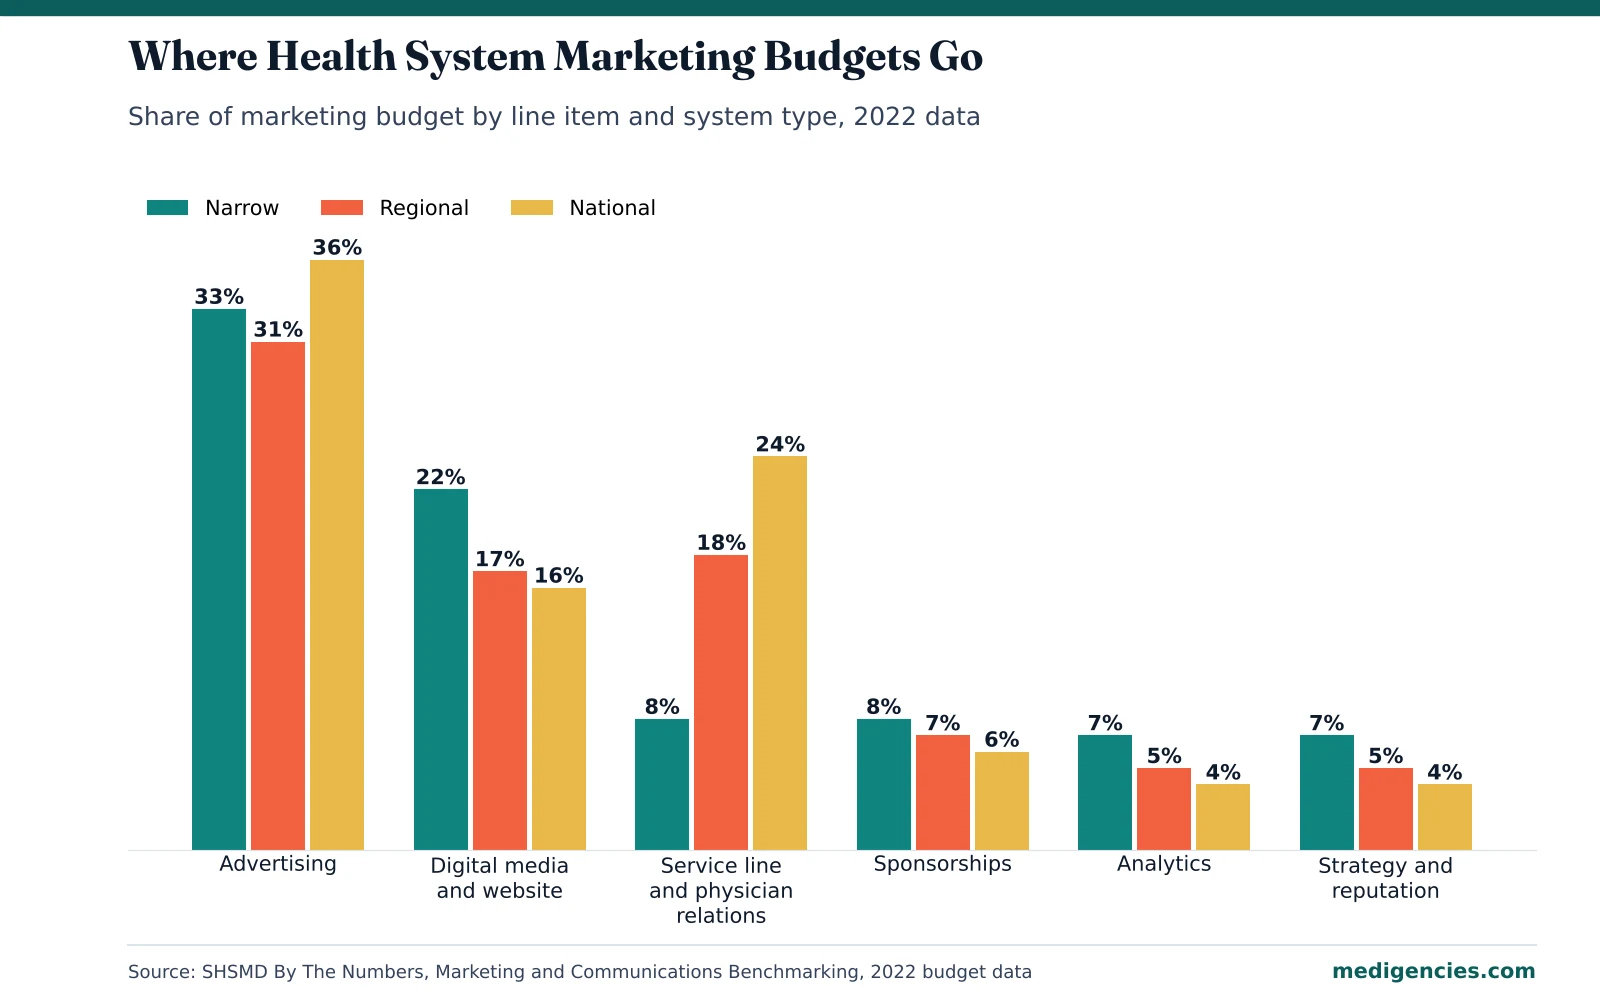
We applied those shares to each median budget. A narrow system’s digital line works out to about $154,000 a year. A regional system’s is about $1.46 million, and a national system’s is about $6.72 million. Analytics gets far less, at roughly $49,000, $430,000 and $1.68 million.
| Budget line | Narrow (% / est. dollars) | Regional (% / est. dollars) | National (% / est. dollars) |
|---|---|---|---|
| Advertising | 33% / $231,000 | 31% / $2.67 million | 36% / $15.1 million |
| Digital media and website | 22% / $154,000 | 17% / $1.46 million | 16% / $6.72 million |
| Service line and physician relations | 8% / $56,000 | 18% / $1.55 million | 24% / $10.1 million |
| Analytics | 7% / $49,000 | 5% / $430,000 | 4% / $1.68 million |
| Strategy and reputation | 7% | 5% | 4% |
| Sponsorships and philanthropy | 8% | 7% | 6% |
Older SHSMD data shows how channel budgets looked in 2017. Then, the median hospital spent $51,050 on pay-per-click, $33,500 on content marketing and $22,000 on search engine marketing. Mobile ads got $20,000, email $18,500 and social media $15,000. TV, by contrast, had a median of $90,000. Also, the average marketing budget reached $5.4 million, up 65% after inflation from 2013. By our math, that was 0.62% of the average $875 million hospital budget.
Our take: Analytics gets 4% to 7% of hospital marketing budgets. So most systems cannot prove return line by line, even when they earn one. Before adding ad spend, fund call tracking, booking attribution and a monthly report. Our page on hospital and health system marketing agencies lists firms that do this work for large systems.
Causal Proof That Hospital Ads Bring in Patients
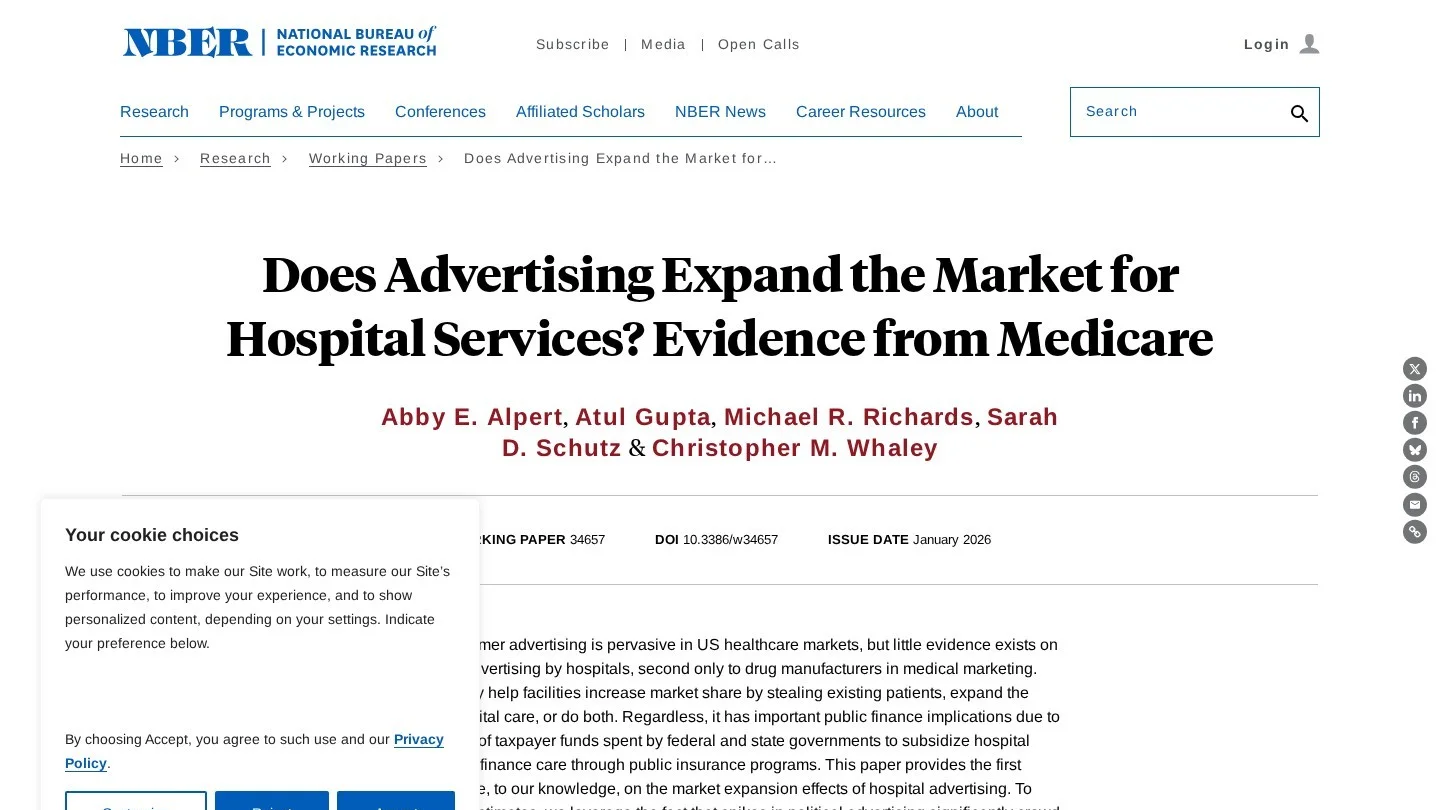
A 10% rise in hospital ads in a regional TV market brought about 9 more admissions per 100,000 traditional Medicare beneficiaries. The study is NBER Working Paper 34657, published in January 2026 by Abby Alpert, Atul Gupta, Michael Richards, Sarah Schutz and Christopher Whaley. In fact, the paper calls it the first causal evidence that hospital ads expand the market.
Their method is clever. Political ads flood local TV in election years, so hospitals get crowded off the air. Then the team compared Nielsen Ad Intel exposures with Medicare claims from January 2015 to November 2016. The average 10% ad change equaled about 150 more ad impressions in a market.
| Measure | Result | What it means in plain numbers |
|---|---|---|
| Inpatient volume elasticity | 0.06 | 10% more ads, about 0.6% more inpatient volume |
| Inpatient spending elasticity | 0.05 | 10% more ads, about 0.5% more inpatient spending |
| Admissions effect | About 9 per 100,000 beneficiaries | Linked to a 10% ad increase, about 150 impressions |
| Medicare spending effect | About $3.3 million a year | For an average regional ad market |
| Outpatient care | Muted overall | For-profit hospitals gained more outpatient volume and revenue |
| Quality shift | None found | Ads did not steer patients by readmission rates |
A second study points the same way. Diwas KC of Emory and Tongil Kim of UT Dallas studied more than 220,000 hospital visits in Massachusetts over 24 months. Hospitals that bought TV ads saw a clear rise in visits. They also drew patients from farther away, and the heavier advertisers tended to have lower readmission rates. As a result, the authors estimated that a blanket ad ban could add 1.2 readmissions per 100 discharges.
Our take: An elasticity of 0.06 is small. So doubling ad spend will not double admissions, and the first dollars do the most work. Spend on the service lines where one extra admission is worth the most, and track each campaign by zip code.
Recruitment Data Shows the Cost Gap Between Social and Broadcast
Health research teams publish their cost per participant, so they give rare, clean data on digital returns. In a JMIR systematic review of 35 studies, Facebook ads recruited participants for a median of $14.41. The mean was $19.77. Besides that, the median click cost $0.51, and 4% of clicks became participants.
| Recruitment channel | Cost per participant | Multiple of the Facebook median |
|---|---|---|
| Television | $1,094.27 | 75.9x |
| Print media | $811.99 | 56.3x |
| Radio | $635.92 | 44.1x |
| $37.77 | 2.6x | |
| Google ads (mean, one study) | $16.22 | 1.1x |
| Facebook ads (median of 35 studies) | $14.41 | 1.0x |
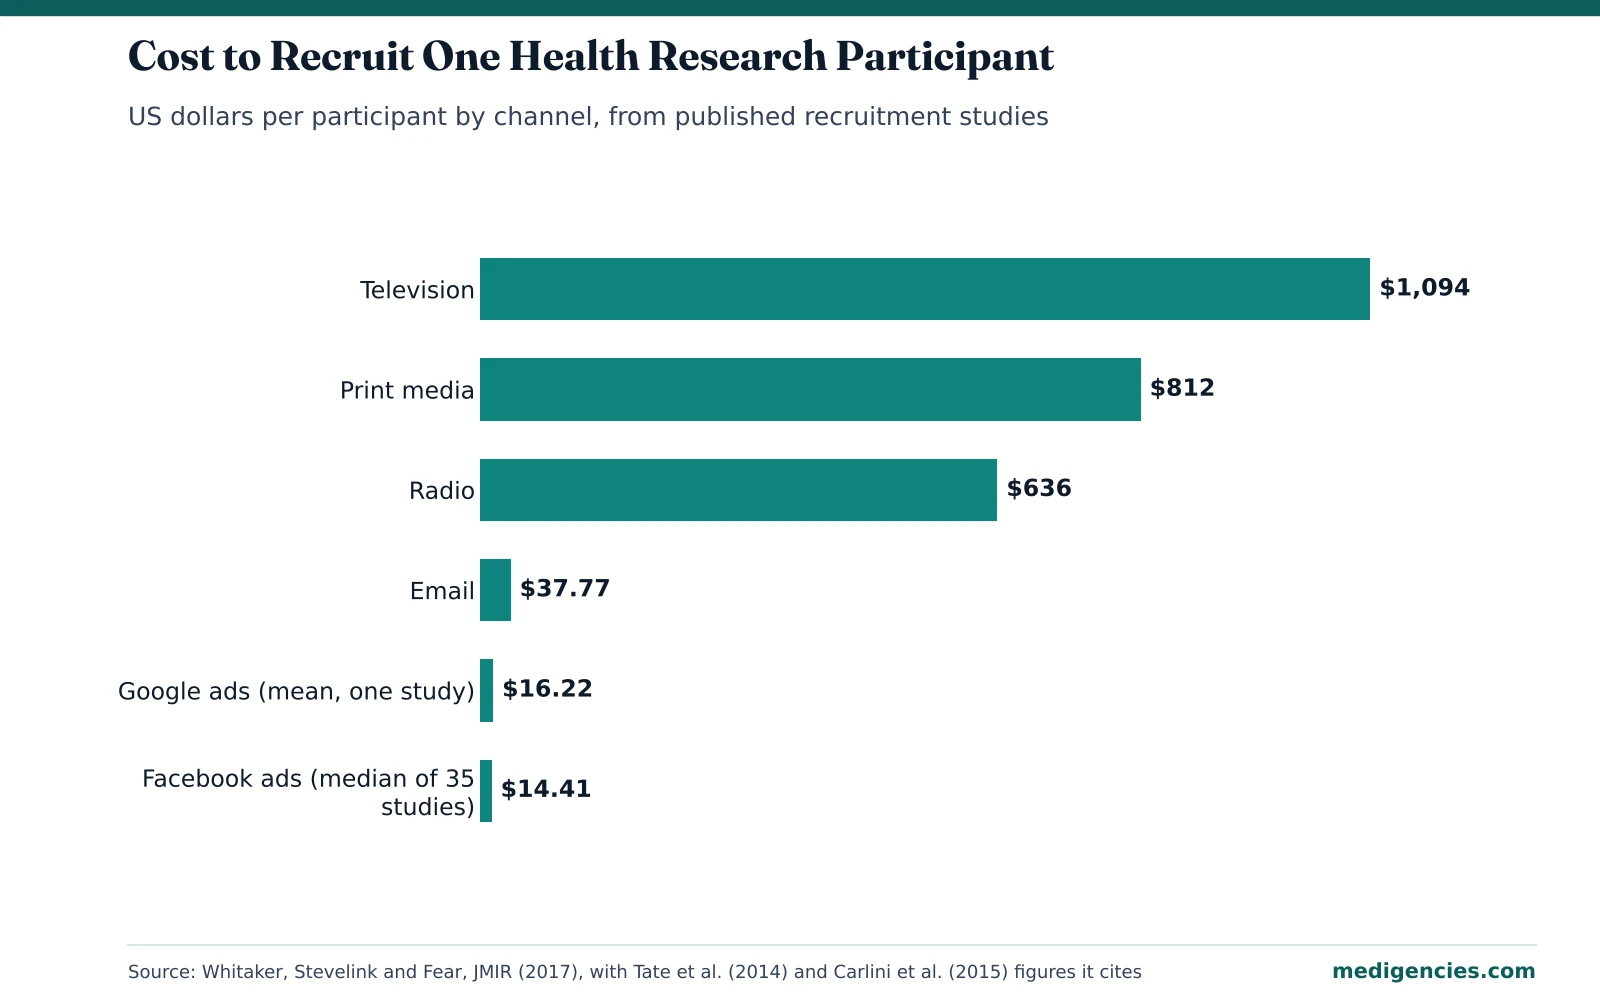
A later meta-analysis pooled 23 studies. Per dollar spent, social media ads had 1.97 times the odds of recruiting a participant compared with non-social methods. Against other online methods alone, the odds ratio was 1.66. However, results varied widely between studies. There was also little data on older adults and people who do not speak English.
Our take: Recruiting a study volunteer is close to booking a new patient. Both need a click, a short screen and a form. So these medians make a fair floor for social ad tests. But the older-adult gap matters for Medicare-heavy service lines. For those, test search and direct mail beside social. Our directory of healthcare social media marketing agencies lists firms that run paid social for providers.
Google’s $8 Return Claim and What Sits Inside It
Google says businesses earn $8 in profit for every $1 they spend on Google Search and Ads. The number appears in its US Economic Impact report. In its method notes, Google builds the figure from three parts.
| Input | Google’s assumption | Origin |
|---|---|---|
| Profit from paid ads | $2 per $1 spent | Hal Varian, Online Ad Auctions, American Economic Review (May 2009) |
| Organic clicks per ad click | 5 | Jansen and Spink, International Journal of Internet Marketing and Advertising (2009) |
| Value of an organic click | About 70% of an ad click | Google’s own discount |
| Total profit per $1 | $8 ($11 before the discount) | Google’s calculation |
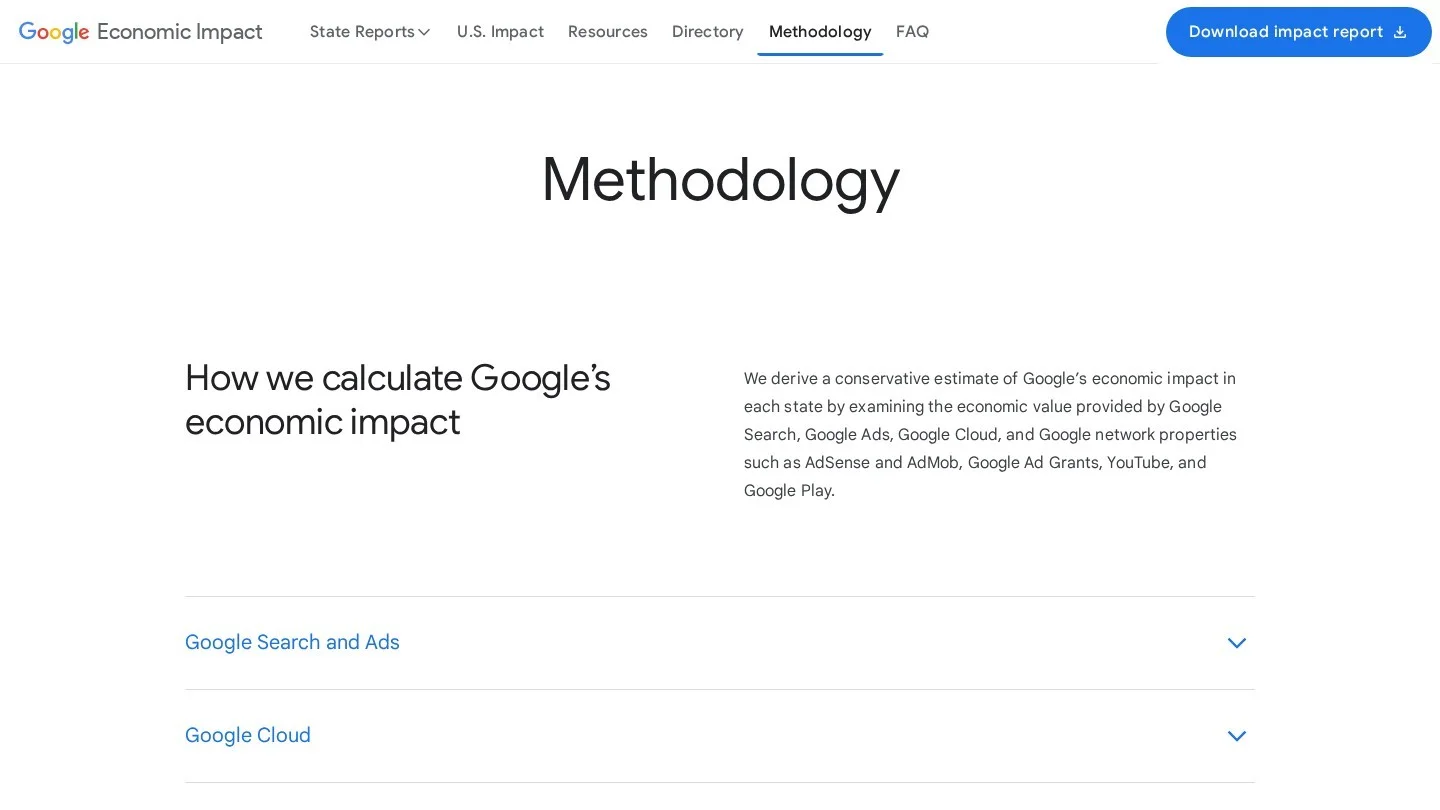
We split the total. The paid ads carry $2, so organic search carries the other $6. So 75% of Google’s own return figure comes from free clicks. Also, the inputs are cross-industry. Health ads face extra rules, such as limits on prescription drug terms and on personalized ads.
Our take: Treat the $8 as Google’s marketing claim. It is not a healthcare benchmark. Even so, its shape is useful. Most of the value sits in organic rankings, which you earn with SEO and good pages. Our healthcare SEO tools guide covers what to use for that work. For the ad side, read our Google healthcare ad rules before you build campaigns.
Turning These Figures Into a Return Estimate for Your Practice
Marketing ROI is net return divided by cost. For a practice, net return is the margin from new patients, minus what you spent to get them. So you need three numbers from your own books: cost per click, conversion rate and margin per new patient.
The recruitment medians give a sourced example of the first two. A $0.51 click with a 4% conversion rate costs $12.75 per sign-up. Then, if 61% of sign-ups are eligible, the median in the same review, each usable lead costs about $20.90. For instance, a $10,000 test at those rates would buy about 694 participants. On TV at $1,094.27 each, the same money buys about 9.
| Step | Input | Value | Running cost |
|---|---|---|---|
| 1. Click | Median cost per click | $0.51 | $0.51 per click |
| 2. Sign-up | Median conversion rate | 4% | $12.75 per sign-up |
| 3. Eligible | Median eligibility rate | 61% | $20.90 per eligible lead |
| 4. Your margin | Your margin per new patient | From your books | ROI = (margin x patients – spend) / spend |
Next, match the window to the service. A dental cleaning patient may return twice a year, so a one-visit ROI will understate them. On the other hand, an urgent care visit may never repeat. Also, use your real show rate, because a booked visit that never happens earns nothing.
Then set a check date. Most ad tests need a few weeks of data before the cost per booked visit settles. So run each test long enough to book at least a few dozen patients. After that, compare the cost per booked visit with your margin. If the margin is higher, the channel pays for itself on the first visit.
Finally, compare channels on the same basis. For example, put search, social and email side by side on cost per completed visit. A cheap click means little if few of those clicks book. In the same way, a pricey TV spot may still pay if it fills a high-margin service line.
Our take: Count booked and completed visits, because form fills alone overstate return. AI assistants now send some patients too, so add that source to your tracking. Our guide to tracking AI referral traffic for medical practices shows the setup. If you want outside help, get matched with a vetted agency that tracks booked patients.
Questions Marketers Ask About Healthcare Marketing ROI
Does Hospital Advertising Actually Increase Patient Volume?
Yes, by a modest amount. In NBER Working Paper 34657, a 10% rise in hospital ads lined up with about 9 more admissions per 100,000 traditional Medicare beneficiaries. The inpatient volume elasticity was 0.06.
How Much Do Hospitals Spend on Marketing?
Health systems spent 0.51% to 0.60% of net patient revenue on marketing in 2022. Median budgets ranged from $700,000 for narrow systems to $42 million for national ones.
Which Channel Recruits Patients Most Cheaply?
In health research recruitment, social media ads cost the least per participant. Facebook’s median was $14.41, against $1,094.27 for TV in one study. Social ads also had 1.97 times the odds of recruiting someone per dollar in a 23-study meta-analysis.
Is Google’s $8 per $1 Figure True for Healthcare?
It is Google’s cross-industry claim, so it is not a healthcare benchmark. By our split, $6 of the $8 comes from organic clicks. Health ads also face rules that other sectors do not.
What Share of Healthcare Ad Spend Is Digital?
Digital took 64% of US healthcare and pharma media ad spending in 2022. The forecast for 2026 is nearly 80%.
We do not take payment to list agencies. Our vetting process explains how firms get in.
Studies and Benchmarks Behind These ROI Figures
- Dartmouth Health Sciences, summary of Schwartz and Woloshin, Medical Marketing in the United States, 1997-2016, JAMA (January 2019)
- Alpert, Gupta, Richards, Schutz and Whaley, Does Advertising Expand the Market for Hospital Services? Evidence From Medicare, NBER Working Paper 34657 (January 2026)
- Penn Leonard Davis Institute, summary of the hospital advertising study (March 2026)
- Emory Goizueta Business School, KC and Kim research on hospital advertising and patient outcomes (December 2020)
- SHSMD By The Numbers, Marketing and Communications Insights, 2022 budget data (PDF)
- Healthcare IT Today, SHSMD marketing budget report, 2017 data (October 2018)
- Gartner, Healthcare Marketing Budget Benchmarks, CMO Spend Survey 2024 data
- Gartner press release, 2026 CMO Spend Survey (June 8, 2026)
- eMarketer, Digital Share of US Healthcare and Pharma Media Ad Spending, 2022 to 2026
- Whitaker, Stevelink and Fear, The Use of Facebook in Recruiting Participants for Health Research Purposes: A Systematic Review, JMIR 19(8):e290 (2017)
- Cost-Effectiveness of Social Media Advertising as a Recruitment Tool: A Systematic Review and Meta-Analysis, Journal of Clinical and Translational Science (2023)
- Google, Economic Impact Report Methodology
Compare Agencies for This Topic
Medical Practice Marketing AgenciesHealthcare Content Marketing AgenciesHealthcare PPC AgenciesHealthcare SEO Agencies
More From the Blog
Statistics
Private Hospital vs Public Hospital Cost Statistics
Hospital costs by ownership in the US, India and the UK, with our own ratios, growth rates and price-page advice for hospital marketers.
Nov 5, 2026

Statistics
Healthcare Mobile Search Statistics
Smartphone ownership, online health lookups by age, portal app use, telemedicine and page speed limits, with our own per-1,000-adults model for clinics.
Nov 5, 2026
Guides
Allergy and Immunology SEO: A Practice Guide for Allergists
An SEO guide for allergy and immunology practices covering seasonal keywords, technical fixes, treatment pages, Maps, society listings, links, AI answers, reviews and a…
Nov 5, 2026