
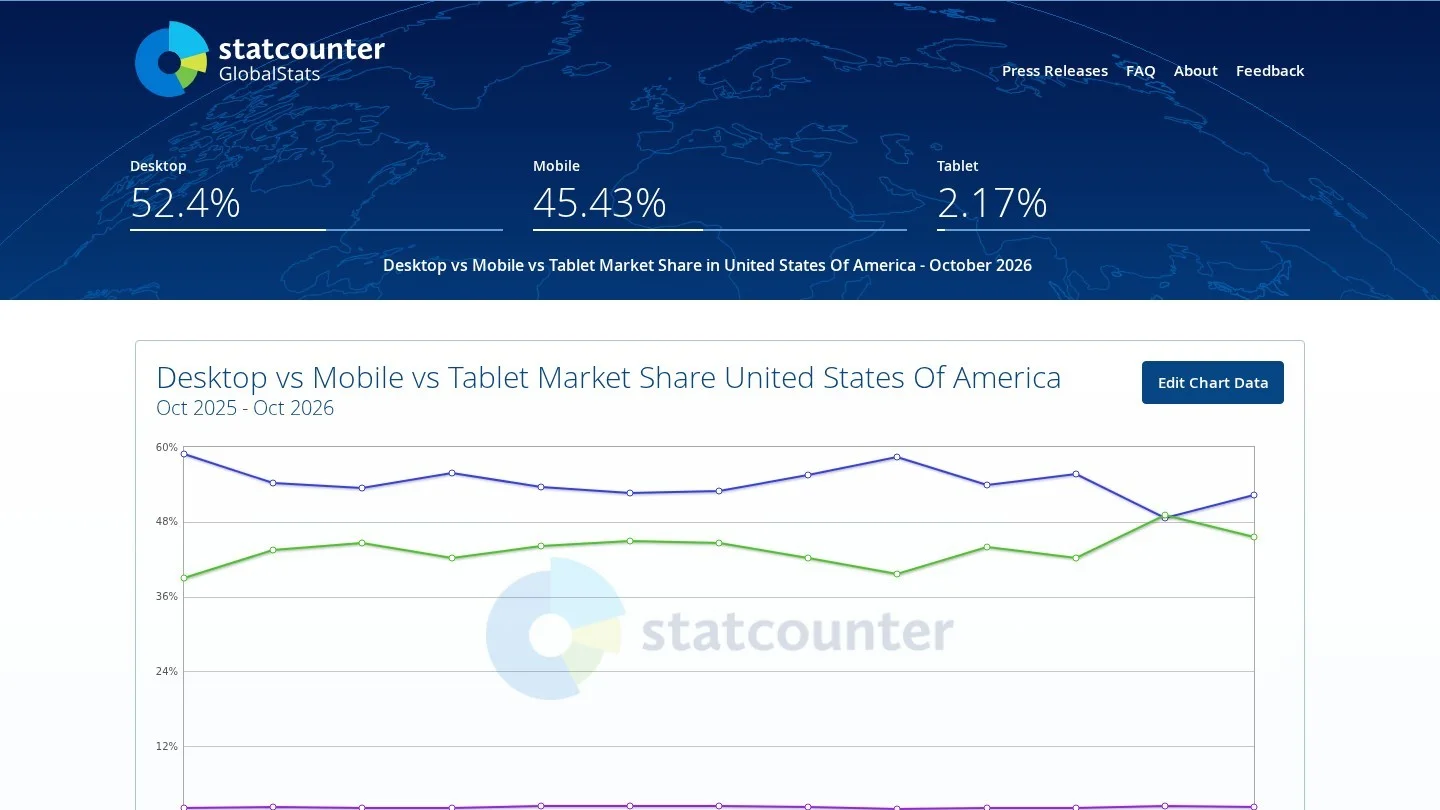
Most health searches in the US now happen on a phone. Phones carried 49.1% of US web visits in September 2026, and tablets added 2.42%. Also, 91% of US adults own a smartphone, and 58.5% looked up health information online in the latest federal count. On top of that, 57% of people who opened a patient portal in 2024 used an app to do it.
We compiled these healthcare mobile search statistics from federal surveys, Pew Research Center, a KFF poll and Google’s own pages. Then we ran our own math in Python. So you get age gaps, growth rates and a per-1,000-adults model, each with its inputs named. After each set of numbers, we explain what it means for clinics, hospitals and their marketers.
The Mobile Patient in Ten Data Points
- Phones and tablets together carried 51.5% of US web visits in September 2026. Desktops carried 48.47%.
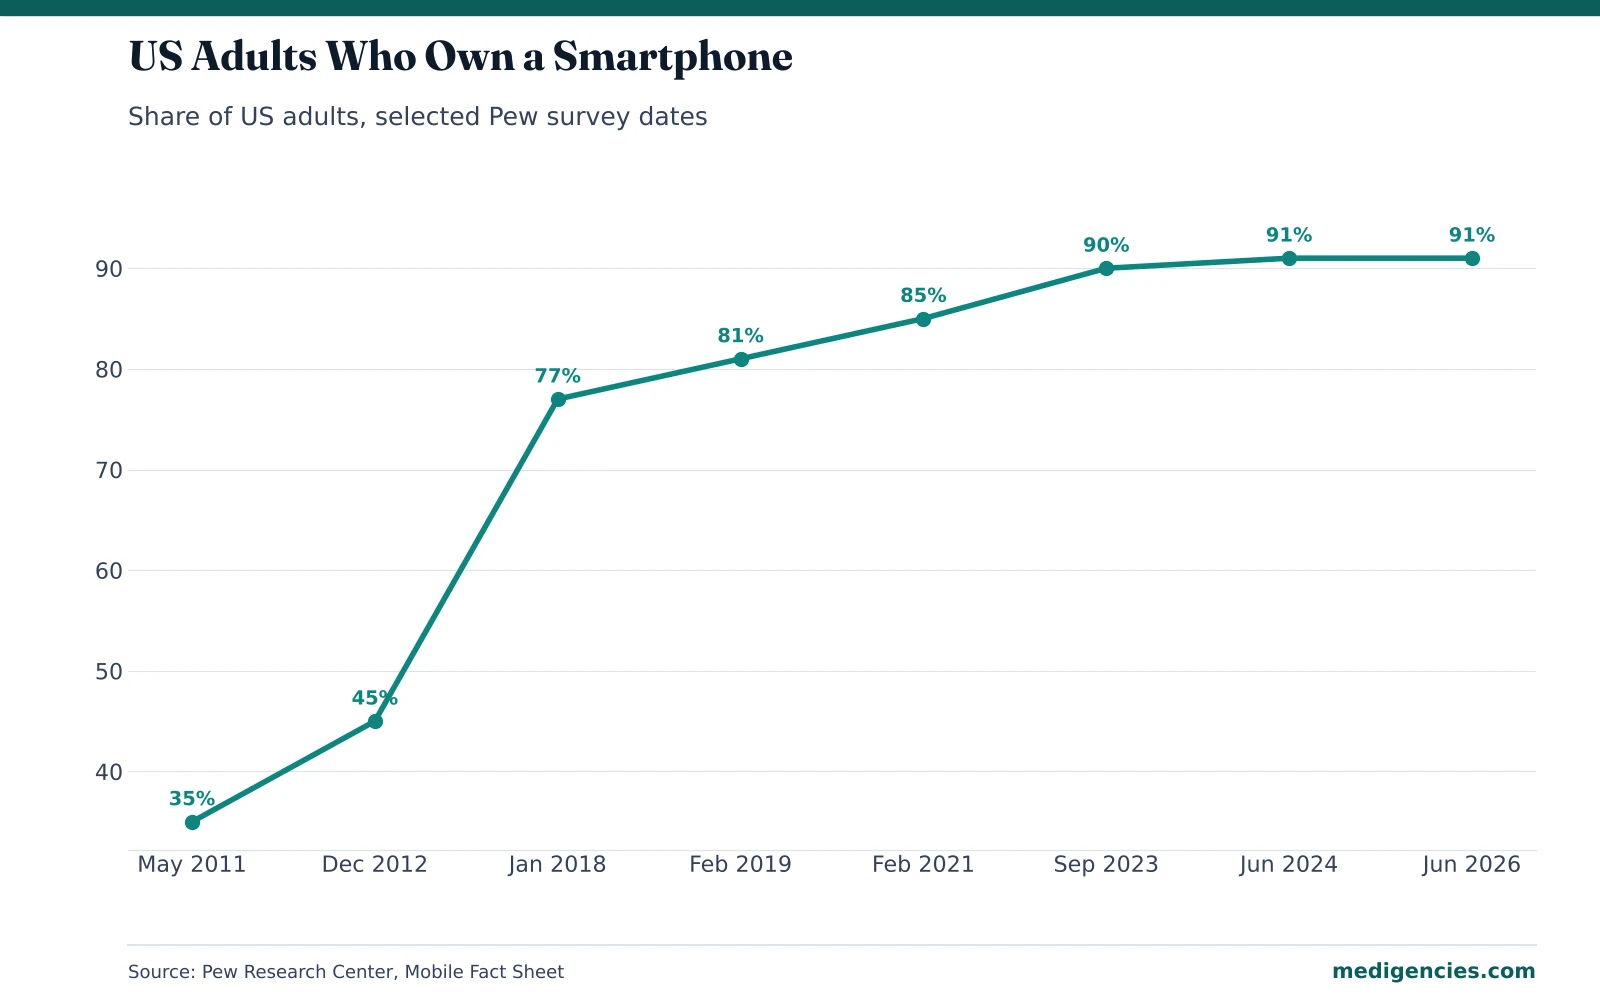
- Smartphone ownership rose from 35% of US adults in 2011 to 91% in 2026. By our math, that is 2.6 times as many owners.
- Only 79% of adults 65 and older own a smartphone. That is 18 points under the rate for adults under 50.
- 16% of adults have a smartphone but no home broadband. In homes earning under $30,000, the share is 29%.
- 58.5% of adults looked up health or medical information online in the second half of 2022. Among those 75 and older, it was 36.3%.
- Google said in 2019 that it gets more than 1 billion health questions a day. That works out to about 11,600 a second.
- App use for patient portals rose from 38% in 2020 to 57% in 2024. Web-only use fell from 60% to 42%.
- 17% of adults use AI chatbots at least once a month for health advice. For adults under 30, it is 25%.
- Google rates a page’s load speed as good when its largest element appears within 2.5 seconds for 75% of visits.
- Tracking code on patient portals and health apps generally touches protected health information under HHS guidance.
Phones Now Carry Half of US Web Visits
Phones carried 49.1% of US web page views in September 2026. Desktops carried 48.47%, and tablets carried 2.42%. So by our math, handheld screens made up 51.5% of all visits that month.
However, these are all-topic numbers. A plumber’s site and a hospital’s site both count. Still, health questions tend to come up at odd hours and away from a desk. For example, a parent checks a rash at 11 p.m., or a patient looks up urgent care from a parking lot.
For clinics: Check your own split first. In Google Analytics, open the device report for the last 90 days. If phones bring more than half your sessions, then test every new page on a phone before you test it on a laptop. Our list of healthcare web design agencies covers firms that build mobile-first practice sites.

Smartphone Ownership Has Reached 91% of US Adults
91% of US adults owned a smartphone in the first half of 2026. That share has held at 91% since June 2024. In fact, the climb has flattened. Ownership was 35% in May 2011, 77% in January 2018 and 90% in September 2023.
The age gap is still wide. Adults under 50 sit at 97%, but only 79% of adults 65 and older own one. Income matters too. Just 80% of adults in homes earning under $30,000 have a smartphone, against 98% in homes earning $100,000 or more. Rural adults trail at 88%.
| Group | Own a smartphone | Smartphone but no home broadband |
|---|---|---|
| Ages 18 to 29 | 97% | 24% |
| Ages 30 to 49 | 97% | 14% |
| Ages 50 to 64 | 91% | 12% |
| Ages 65 and older | 79% | 16% |
| Income under $30,000 | 80% | 29% |
| Income $30,000 to $69,999 | 91% | 18% |
| Income $70,000 to $99,999 | 96% | 12% |
| Income $100,000 or more | 98% | 7% |
| All US adults | 91% | 16% |
Who Relies on a Phone With No Home Broadband
16% of US adults go online through a smartphone but have no home broadband. That share was 8% in 2013. Also, it is highest at the low end of the income scale. By our math, adults in homes under $30,000 are 4.1 times as likely to rely on a phone as adults in homes over $100,000.
Young adults rely on phones the most, at 24%. On the other hand, 16% of adults 65 and older are phone-only too. Census data for 2021 points the same way. Smartphone-only homes were more likely to earn $25,000 or less. They were also more likely to have a householder 65 or older.
For clinics: Community health centers and practices with many Medicaid patients should treat the phone as the only screen. For those patients, a PDF intake form or a desktop-only portal is a wall. So build intake forms that work with a thumb, and send reminders by text.
How Often Adults Search for Health Information Online
58.5% of US adults looked up health or medical information online between July and December 2022. Next, 46.1% looked up medical test results, and 41.5% contacted a doctor or doctor’s office over the internet. The federal National Health Interview Survey sampled 14,020 adults for these figures.
| Age group | Looked up health information | Contacted a doctor online | Looked up test results | Search-to-contact gap |
|---|---|---|---|---|
| 18 to 29 | 62.7% | 41.5% | 44.2% | 21.2 points |
| 30 to 44 | 67.2% | 47.7% | 50.5% | 19.5 points |
| 45 to 64 | 58.2% | 43.2% | 48.9% | 15.0 points |
| 65 to 74 | 51.1% | 37.2% | 44.5% | 13.9 points |
| 75 and older | 36.3% | 24.3% | 29.8% | 12.0 points |
| All adults | 58.5% | 41.5% | 46.1% | 17.0 points |
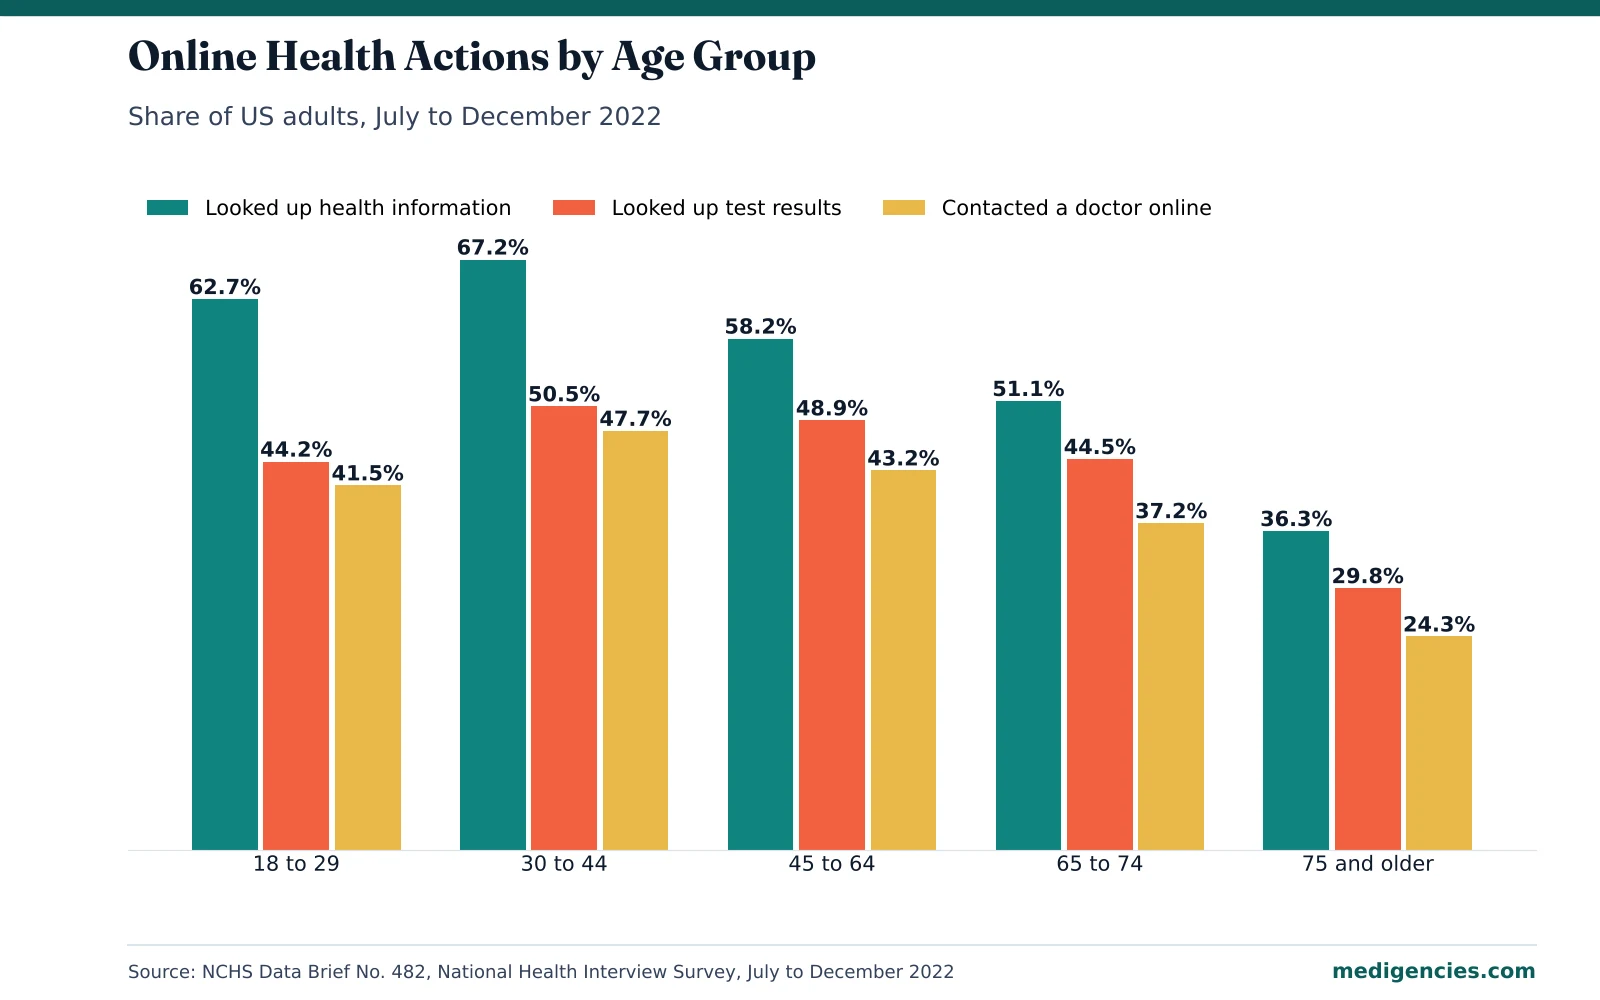
We worked out the gap between searching and contacting a doctor for each age group. Adults 18 to 29 show the widest gap, at 21.2 points. So for every three young adults who search, only about two contact a practice online. Women also search more than men, at 63.3% against 53.5%. By our math, that is 1.18 times the male rate.
The Age Drop After 65
The steepest fall comes after 75. Adults 30 to 44 look up health information at 67.2%, but adults 75 and older do so at 36.3%. By our math, the older group searches at 54% of the younger group’s rate.
Now set that against phone ownership. 79% of adults 65 and older own a smartphone. Yet only 51.1% of adults 65 to 74 and 36.3% of those 75 and older looked up health information online. These are two different surveys, so read the gap as a rough guide. Even so, it points to 28 to 43 points of older adults who own a phone but do not search for health online.
For clinics: For Medicare-age patients, search is only one path. So pair mobile pages with a click-to-call button and a phone line staffed at peak hours. Also, many adult children search on behalf of a parent. Write some pages for them, such as “how to book a visit for your mother.” Next, our list of senior living marketing agencies covers firms that work with this audience.
How Mobile Health Lookups Began in 2012
Back in 2012, 31% of cell phone owners used their phone to look up health information. That was up from 17% in 2010. Among smartphone owners, the share was 52%. Besides that, 19% of smartphone owners had a health app.
At the time, 85% of adults owned a cell phone. So by our math, about 26% of all adults used a phone for health information in 2012.
Google Handles Over 1 Billion Health Questions a Day
In March 2019, David Feinberg, then head of Google Health, said Google gets more than 1 billion health questions every day. He also put health at about 7% of daily searches. That is Google’s own claim, and it has not shared a newer total. By our math, 1 billion a day equals about 694,000 health questions a minute, or about 11,600 a second.
Then add the device split. If health searches follow the all-topic web split, more than half of those questions arrive on phones and tablets. That is our estimate, because Google does not publish a health-only device split.
For clinics: A health question on a phone is short and urgent. Think of “knee swelling after run” or “urgent care open now.” So answer the question in the first two lines of each page. Then show your hours and a call button. Our healthcare SEO tools guide covers how to find the real questions in Search Console. If you want help, our healthcare SEO agencies directory lists vetted firms.
Patient Portal Visits Have Moved to Phone Apps
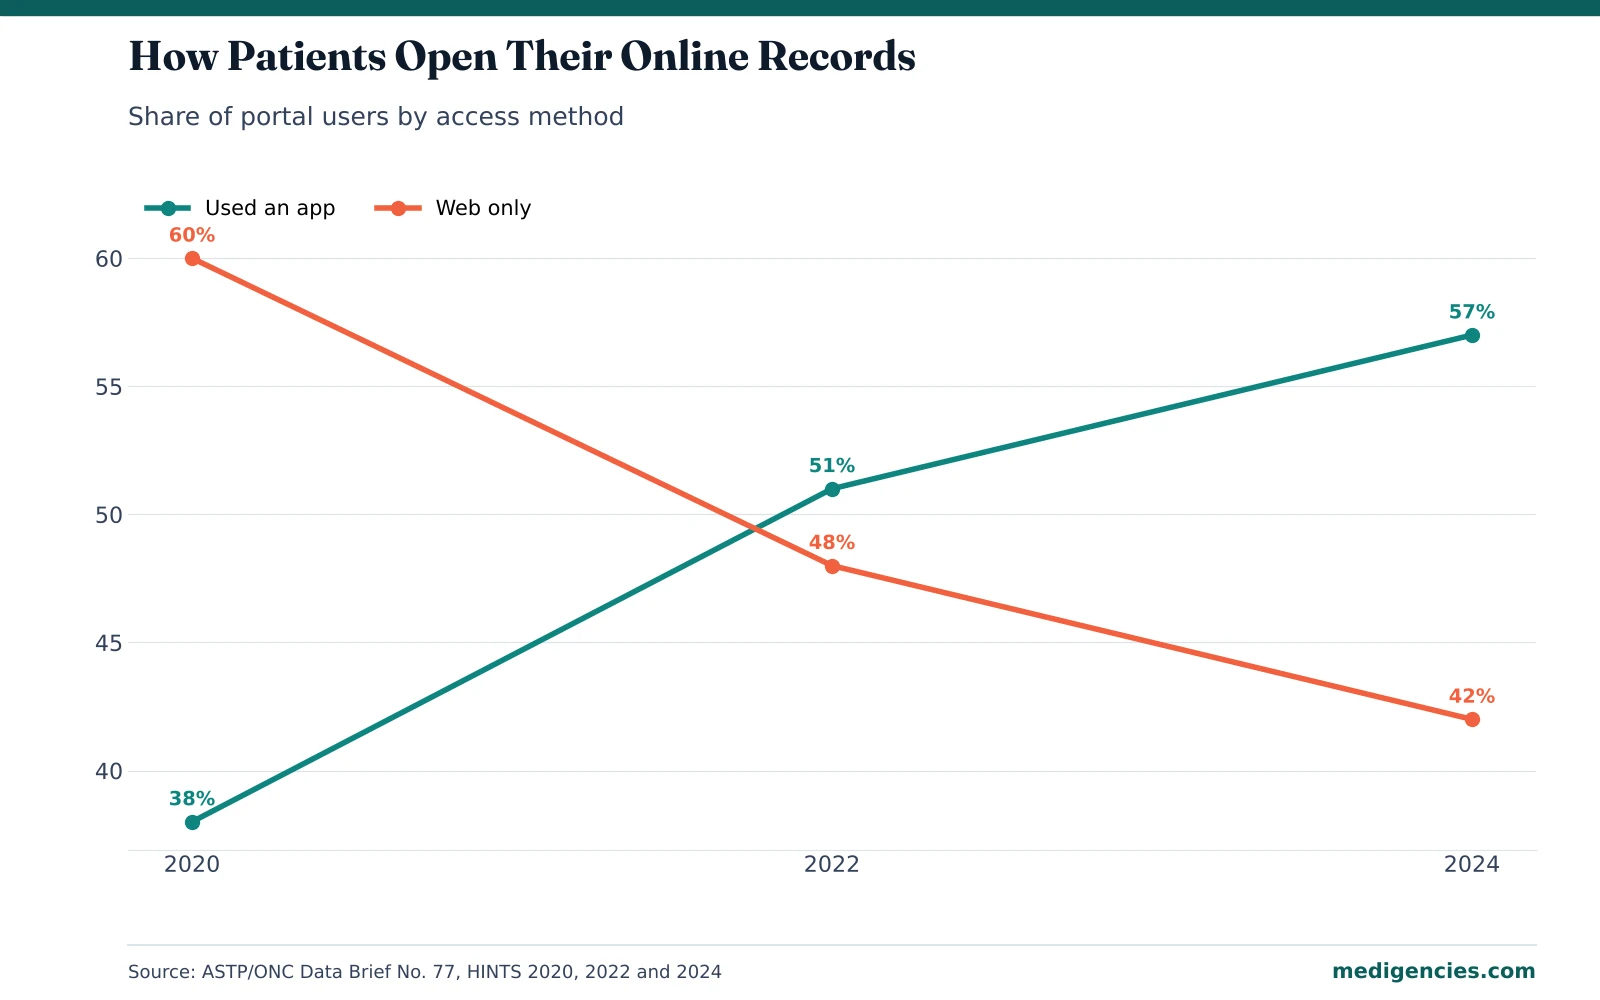
57% of people who used a patient portal in 2024 used an app, alone or along with a website. Only 42% used the web alone. In 2020, those shares were the other way round. Back then, 38% used an app and 60% used the web only.
| Measure | 2020 | 2022 | 2024 | Change, 2020 to 2024 |
|---|---|---|---|---|
| Offered online record access | 59% | 73% | 77% | +18 points |
| Offered and accessed in the past year | 38% | 57% | 65% | +27 points |
| Used an app to access records | 38% | 51% | 57% | +19 points |
| Web-only access | 60% | 48% | 42% | -18 points |
| Accessed for someone else (proxy) | 24% | 46% | 51% | +27 points |
Provider nudges made a large difference. Among people whose provider encouraged portal use, 87% logged in. Among those not encouraged, 57% did. By our math, that is a 30-point lift, or 1.5 times the rate. Also, 89% of those offered access in 2024 were encouraged, up from 79% in 2020.
For clinics: Your portal app is now a marketing channel. So link to it from every confirmation text, and tell patients about it at checkout. Also, 59% of users juggled more than one portal in 2024, up from 50% in 2022. As a result, a clear app name and icon matter more than they used to.
Telemedicine and AI Chatbots as New Mobile Doorways
37.0% of US adults used telemedicine in 2021. Women used it more than men, at 42.0% against 31.7%. Use also rose with age. For example, 43.3% of adults 65 and older used it, against 29.4% of adults 18 to 29.
Place mattered as well. In the central counties of large metro areas, 40.3% used telemedicine. In rural noncore counties, it was 27.5%. By our math, city residents used it at 1.47 times the rural rate.
AI chatbots are a newer front door. In June 2024, 17% of adults used them at least once a month for health information or advice. For adults under 30, the share was 25%. Still, trust is low. 63% of the public were not confident that chatbots give accurate health information.
For clinics: Older patients took to video visits faster than young ones did. So promote telehealth on pages for Medicare-age services too. Also, AI tools pull answers from clear, well-structured pages. Our guide to tracking AI referral traffic for medical practices shows how to see those visits. For outside help, browse our healthcare AEO and GEO agencies.
Page Speed Limits for Mobile Health Pages
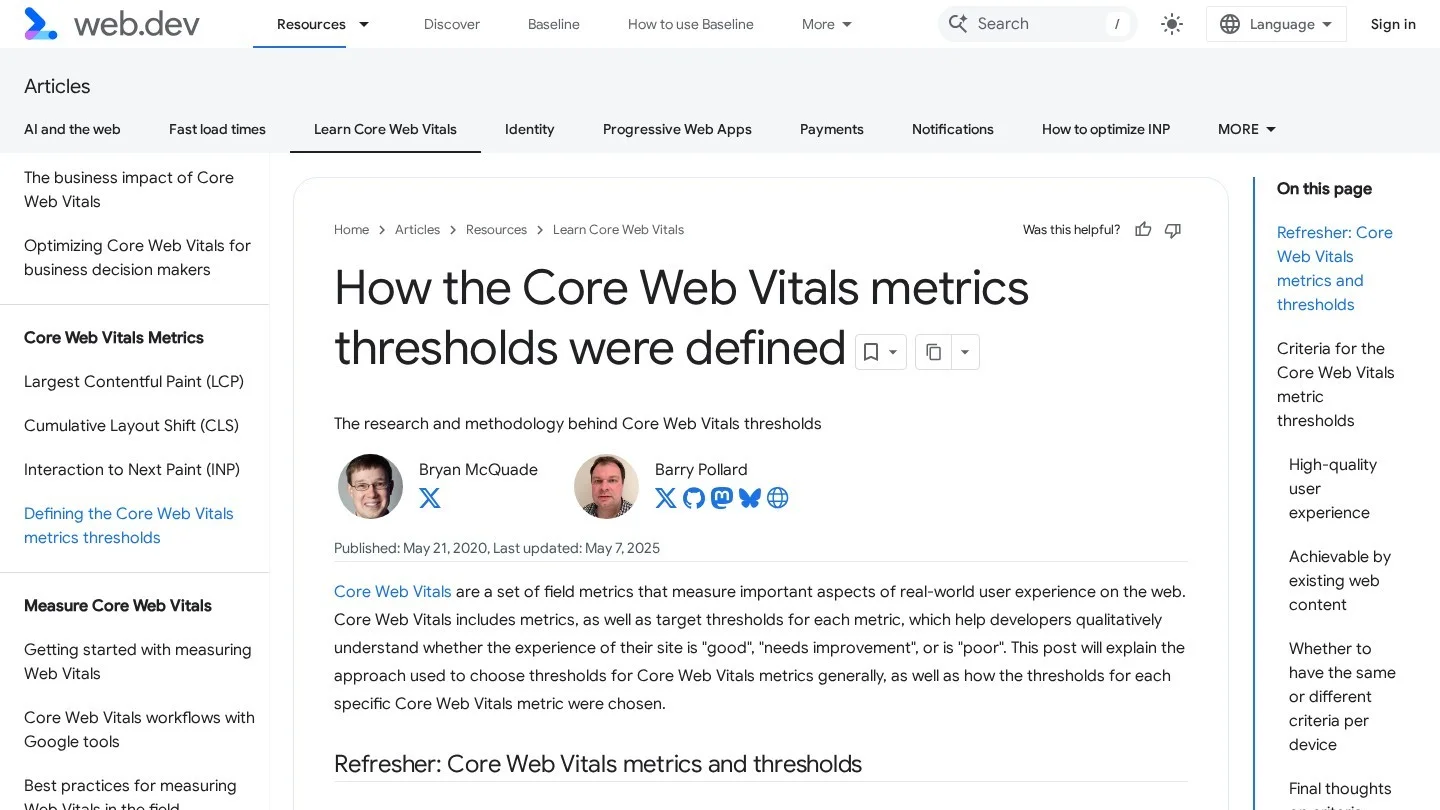
Google rates page experience with three Core Web Vitals. Each one is judged at the 75th percentile of real visits. The same limits apply on phones and desktops. However, Google set most of them with slower mobile devices and networks in mind.
| Metric | What it measures | Good | Needs improvement | Poor |
|---|---|---|---|---|
| Largest Contentful Paint (LCP) | When the main content shows | 2.5 seconds or less | 2.5 to 4 seconds | Over 4 seconds |
| Interaction to Next Paint (INP) | How fast a tap gets a response | 200 ms or less | 200 to 500 ms | Over 500 ms |
| Cumulative Layout Shift (CLS) | How much the page jumps | 0.1 or less | 0.1 to 0.25 | Over 0.25 |
Slow pages have long cost mobile visits. In a 2017 Google study of more than 900,000 mobile landing pages, the average page took 22 seconds to load. Also, 53% of mobile visitors left a page that took longer than three seconds. Going from one to seven seconds raised the chance of a bounce by 113%.
Page weight was the main cause. 70% of the pages were over 1 MB, and 12% were over 4 MB. A 1.49 MB page took seven seconds on a fast 3G link. By our math, that link moved about 213 KB a second.
For clinics: Large doctor photos and hero videos are the usual culprits on practice sites. So compress every image, and keep the top of each service page under 1 MB. Then check field data in Search Console’s Core Web Vitals report each month.
What Google Indexes When a Patient Searches on a Phone
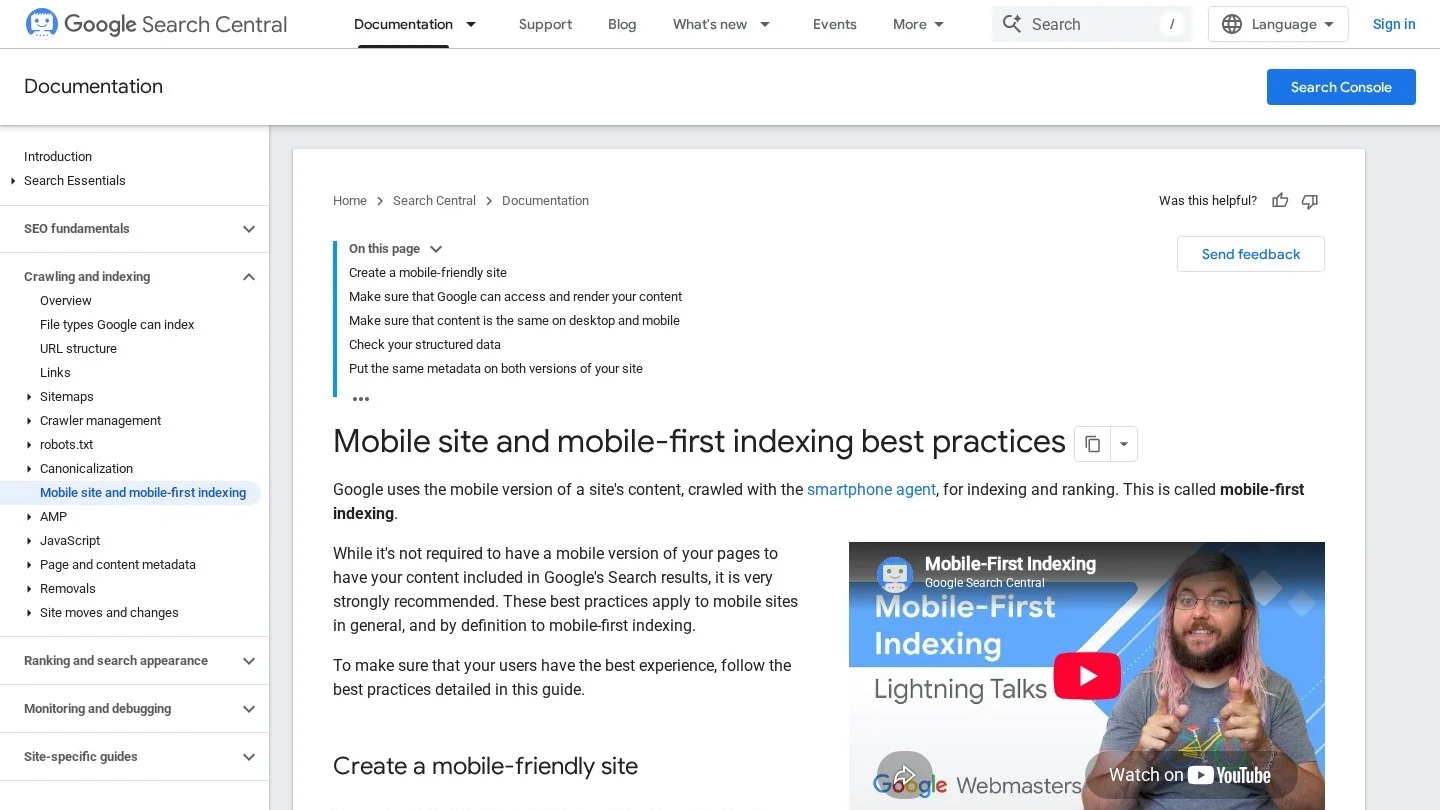
Google indexes and ranks the mobile version of a site. It crawls pages with a smartphone agent. In October 2023, Google said that mobile-first indexing “has landed” across the web.
Google wants both versions to match. For example, the mobile page should carry the same main content, titles and meta descriptions as the desktop page. Structured data and image alt text should also match. Besides that, Google does not load content that needs a tap or swipe to appear. If the mobile page has less content, Google warns of some traffic loss.
For clinics: Many practice themes hide physician bios, insurance lists or FAQs on phones to save space. Those hidden blocks can drop out of Google’s view. So use tabs or accordions that still sit in the page code, and keep schema for each physician on the mobile page.
HIPAA Tracking Rules for Health Apps and Portals
HHS’s Office for Civil Rights first issued its online tracking guidance in November 2022. Under that guidance, apps that a HIPAA-covered entity offers generally collect protected health information. That includes what users type and their device IDs. So sending that data to a tracking vendor counts as a disclosure.
Logged-in pages carry the same risk. For instance, tracking on patient portals and telehealth platforms generally has access to health data. In those cases, the vendor needs a business associate agreement. Then, in June 2024, a federal court in Texas vacated one part of the guidance. That part covered IP addresses tied to visits on public, unauthenticated pages about health conditions or providers.
For clinics: Mobile apps and portals are where patients now log in, so they need the tightest tag setup. Keep ad pixels off logged-in screens unless a business associate agreement covers the vendor. Our page on Google’s healthcare ad rules covers the ad side of the same problem.
Our Mobile Patient Model per 1,000 Adults
We turned the survey rates into counts for a town of 1,000 adults. Each row uses one sourced rate. Because the rates come from different surveys and years, treat the counts as rough sizes for planning.
| Step | Rate used | Adults out of 1,000 | Data period |
|---|---|---|---|
| Own a smartphone | 91% | 910 | 2026 |
| Rely on a phone with no home broadband | 16% | 160 | 2026 |
| Looked up health information online | 58.5% | 585 | Second half of 2022 |
| Looked up test results online | 46.1% | 461 | Second half of 2022 |
| Contacted a doctor online | 41.5% | 415 | Second half of 2022 |
| Offered and used a patient portal | 65% | 650 | 2024 |
| Used a portal through an app | 65% x 57% | About 370 | 2024 |
| Use AI chatbots monthly for health | 17% | 170 | June 2024 |
Two numbers jump out. First, about 370 of every 1,000 adults now reach their health records through an app. Second, 585 search for health information, but only 415 contact a doctor online. So roughly 170 people per 1,000 research their health and then go quiet.
For clinics: Those 170 quiet searchers are the target for mobile marketing. Give them a way to act on the same screen, such as online booking or a text-to-schedule link. Then measure booked visits from phones, because clicks alone overstate results. Our healthcare digital marketing ROI statistics show how to turn bookings into a return figure. For click costs by specialty, see our healthcare PPC statistics.
Clinic Owners’ Mobile Search Questions, Answered
What Percentage of Health Searches Happen on Mobile?
Google does not publish a health-only device split. Across all topics, phones carried 49.1% of US web visits in September 2026, and tablets added 2.42%. So by our estimate, more than half of health page visits come from handheld screens.
How Many Americans Look Up Health Information Online?
58.5% of US adults looked up health or medical information online in the second half of 2022. Women did so at 63.3% and men at 53.5%. Adults 30 to 44 had the highest rate, at 67.2%.
How Many Health Searches Does Google Get Each Day?
Google said in 2019 that it receives more than 1 billion health questions a day. It put health at about 7% of its daily searches.
Do Older Patients Use Smartphones for Health?
79% of adults 65 and older own a smartphone. But only 51.1% of adults 65 to 74 and 36.3% of adults 75 and older looked up health information online. On the other hand, 43.3% of adults 65 and older used telemedicine in 2021, the highest of any age group.
Do Patients Prefer Portal Apps or Websites?
Apps now lead. In 2024, 57% of portal users used an app, and 42% used the web only. In 2020, it was 38% for apps and 60% for web only.
We do not take payment to list agencies. Our vetting process explains how firms get in, or you can get matched with a vetted agency.
Where Each Mobile Number Comes From
- StatCounter, Desktop vs Mobile vs Tablet Market Share, United States (September 2026)
- Pew Research Center, Mobile Fact Sheet (2026 survey data)
- US Census Bureau, Computer and Internet Use in the United States: 2021 (June 2024)
- Wang and Cohen, Health Information Technology Use Among Adults: United States, July to December 2022, NCHS Data Brief No. 482 (October 2023)
- Fox and Duggan, Mobile Health 2012, Pew Research Center (November 2012)
- Becker’s Hospital Review, Google Receives More Than 1 Billion Health Questions Every Day (March 2019)
- Richwine, Individuals’ Access and Use of Patient Portals and Smartphone Health Apps, 2024, ASTP/ONC Data Brief No. 77
- Lucas and Villarroel, Telemedicine Use Among Adults: United States, 2021, NCHS Data Brief No. 445 (October 2022)
- KFF, Poll: Most Who Use Artificial Intelligence Doubt AI Chatbots Provide Accurate Health Information (August 2024)
- web.dev, How the Core Web Vitals Metrics Thresholds Were Defined
- Think with Google, Find Out How You Stack Up to New Industry Benchmarks for Mobile Page Speed (February 2017)
- Google Search Central Blog, Mobile-First Indexing Has Landed (October 2023)
- Google Search Central, Mobile Site and Mobile-First Indexing Best Practices
- HHS Office for Civil Rights, Use of Online Tracking Technologies by HIPAA Covered Entities and Business Associates
Compare Agencies for This Topic
Digital Health and Healthtech Marketing AgenciesMedical Practice Marketing AgenciesSenior Living Marketing AgenciesHealthcare AEO and GEO AgenciesHealthcare PPC AgenciesHealthcare SEO Agencies
More From the Blog

Statistics
Private Hospital vs Public Hospital Cost Statistics
Hospital costs by ownership in the US, India and the UK, with our own ratios, growth rates and price-page advice for hospital marketers.
Nov 5, 2026

Statistics
Healthcare Digital Marketing ROI Statistics
Hospital ad effects, health system marketing budgets, cost per patient by channel and Google's return claim, with our own math for clinics and hospitals.
Nov 5, 2026

Guides
Allergy and Immunology SEO: A Practice Guide for Allergists
An SEO guide for allergy and immunology practices covering seasonal keywords, technical fixes, treatment pages, Maps, society listings, links, AI answers, reviews and a…
Nov 5, 2026