
Russia had the highest ischemic heart disease death rate in the G20 in 2021, at 212.9 deaths per 100,000 people after age standardization. Japan’s was the lowest, at 25.4, while the United States, at 78.9, ranked eighth of the 19 G20 countries with published figures and highest of the nine high-income members.
We started with Global Burden of Disease (GBD) 2021 estimates and added WHO, OECD and CDC figures. In Python we worked out ratios against the US, rank changes since 1990 and gaps between regions. Under each set of numbers is a Medigencies takeaway for US cardiology practices and the marketers who work with them.
Heart Disease Death Rates Worldwide in Seven Findings
- Japan’s ischemic heart disease death rate (25.4 per 100,000) is about one-eighth of Russia’s (212.9) on the same age-standardized basis, GBD 2021.
- The US rate of 78.9 is 3.1 times Japan’s, 2.6 times France’s and 1.5 times Canada’s.
- The US was third-highest of nine high-income G20 countries in 1990 and highest by 2021, after a 56% decline that was the second-smallest in the group.
- Had the US matched the average decline of its eight peers, its 2021 rate would have been about 62.6, roughly one-fifth lower.
- Rates rose from 1990 to 2021 in Indonesia (+39%), China (+18%), India (+10%) and South Africa (+5%), and Mexico’s barely moved.
- Central Asia’s 2022 ischemic heart disease death rate of 268.9 is 10.3 times high-income Asia Pacific’s 26.0, using GBD 2022 regions.
- US heart disease deaths totaled 683,491 in 2024, and the age-adjusted rate fell 2.8% from 2023.
Ischemic Heart Disease Death Rates Across G20 Countries
Ischemic heart disease is the cause group that includes heart attacks. The table ranks 19 G20 countries by their 2021 age-standardized death rate from it, using GBD 2021 estimates for 1990 and 2021. We calculated the change, rank and US ratio columns from those values.
| Country | 1990 rate | 2021 rate | Change 1990 to 2021 | Rank 1990 | Rank 2021 | US rate as a multiple |
|---|---|---|---|---|---|---|
| Russian Federation | 311.27 | 212.91 | -31.6% | 1 | 1 | 0.37 |
| Saudi Arabia | 225.52 | 185.90 | -17.6% | 2 | 2 | 0.42 |
| India | 137.87 | 151.17 | +9.6% | 10 | 3 | 0.52 |
| Indonesia | 102.96 | 143.25 | +39.1% | 14 | 4 | 0.55 |
| Turkey | 204.65 | 133.38 | -34.8% | 3 | 5 | 0.59 |
| Mexico | 113.39 | 113.21 | -0.2% | 12 | 6 | 0.70 |
| China | 94.14 | 110.91 | +17.8% | 15 | 7 | 0.71 |
| United States | 179.83 | 78.92 | -56.1% | 6 | 8 | 1.00 |
| South Africa | 74.43 | 78.04 | +4.9% | 17 | 9 | 1.01 |
| Brazil | 136.61 | 64.01 | -53.1% | 11 | 10 | 1.23 |
| Germany | 192.40 | 63.67 | -66.9% | 5 | 11 | 1.24 |
| Argentina | 158.80 | 60.79 | -61.7% | 8 | 12 | 1.30 |
| United Kingdom | 196.49 | 52.11 | -73.5% | 4 | 13 | 1.51 |
| Canada | 156.66 | 51.12 | -67.4% | 9 | 14 | 1.54 |
| Italy | 108.50 | 44.27 | -59.2% | 13 | 15 | 1.78 |
| Australia | 175.07 | 44.08 | -74.8% | 7 | 16 | 1.79 |
| France | 84.26 | 29.87 | -64.6% | 16 | 17 | 2.64 |
| Republic of Korea | 60.15 | 28.27 | -53.0% | 19 | 18 | 2.79 |
| Japan | 66.69 | 25.36 | -62.0% | 18 | 19 | 3.11 |
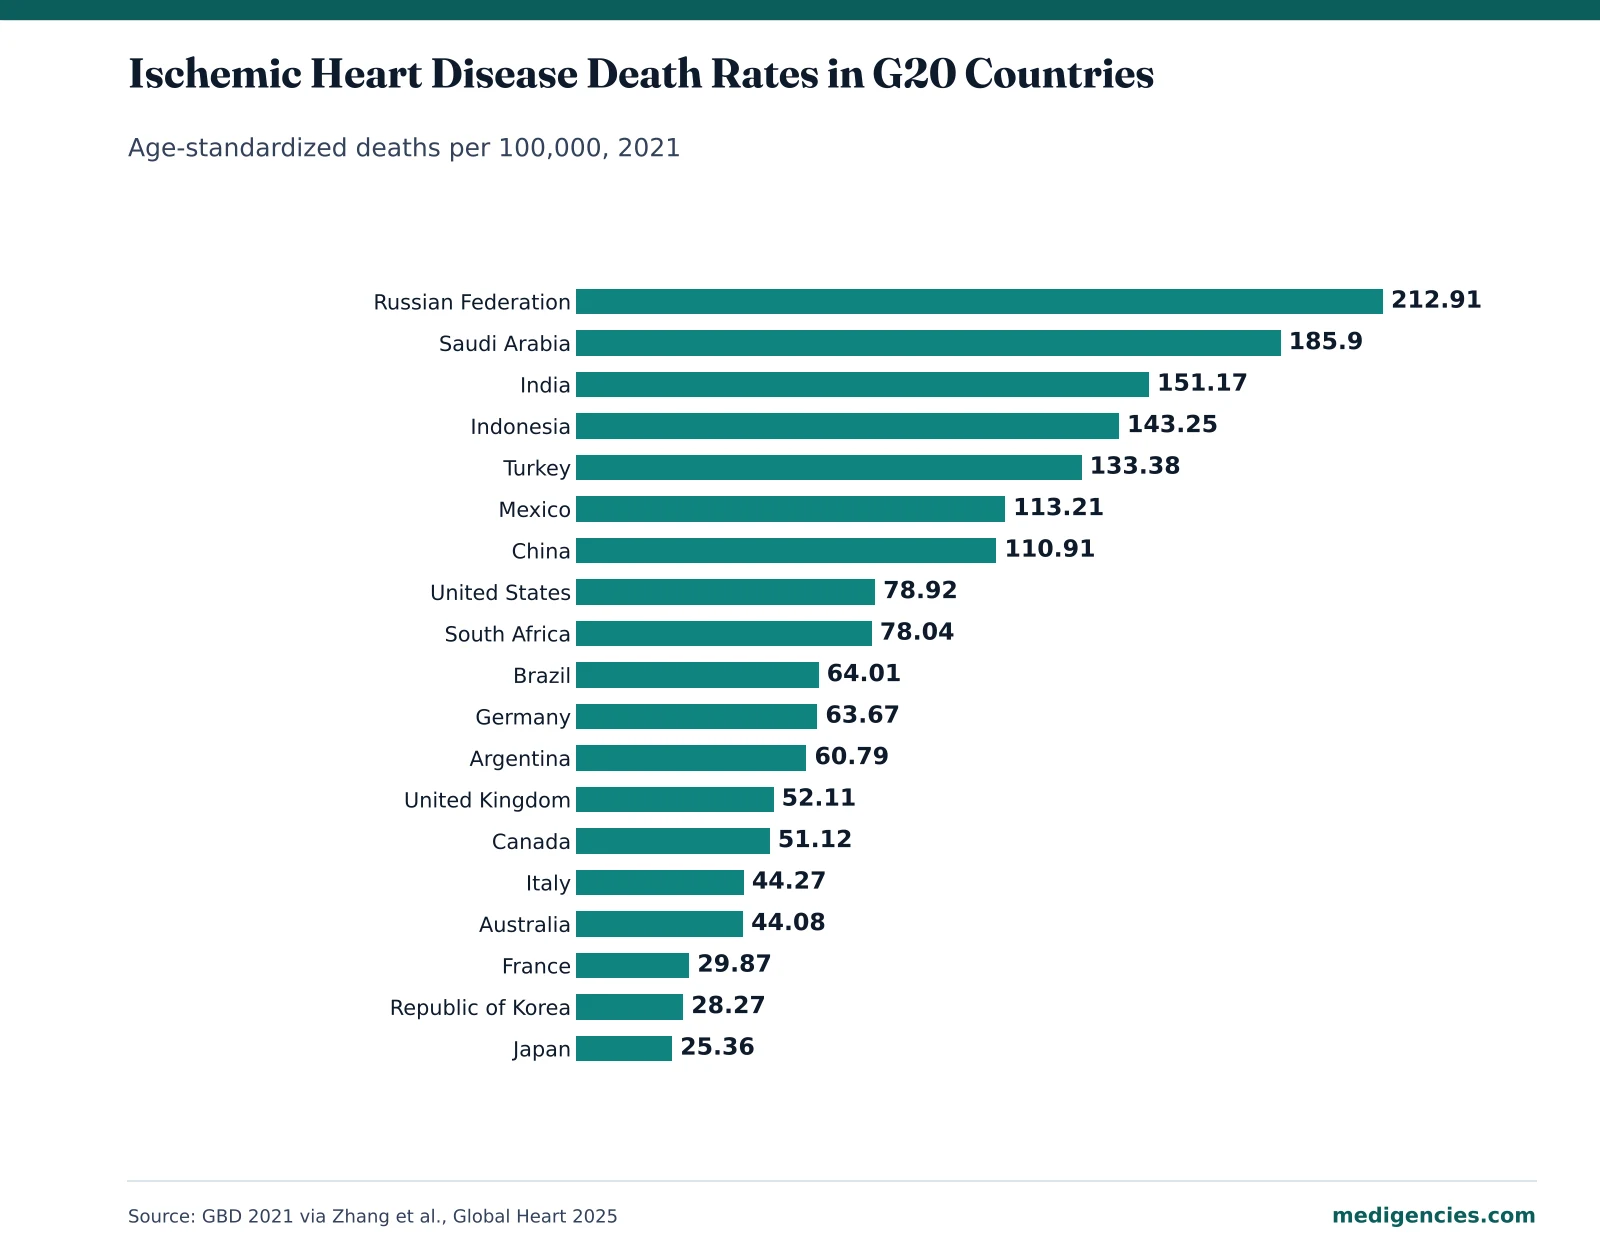
Worldwide, the rate fell 31.6%, from 158.90 in 1990 to 108.73 in 2021, and the 2021 US rate sat 27% under that global figure. India, Indonesia, Mexico and China each had a lower rate than the US in 1990 and a higher one by 2021.
Medigencies takeaway: Sitting below the world average says little about US heart health. That average is pulled up by large countries where rates are climbing, and among the nine high-income G20 members the US rate is the highest. Prevention pages should tell readers that most heart attack risk factors can be measured and treated, then give them a way to book the measurement.
How Far the US Trails Other Wealthy Countries
We divided the 2021 US rate by each high-income peer’s. It comes out at 3.11 times Japan’s and 2.79 times South Korea’s. Against Canada and the UK the multiple is about 1.5, and Germany comes closest at 1.24.
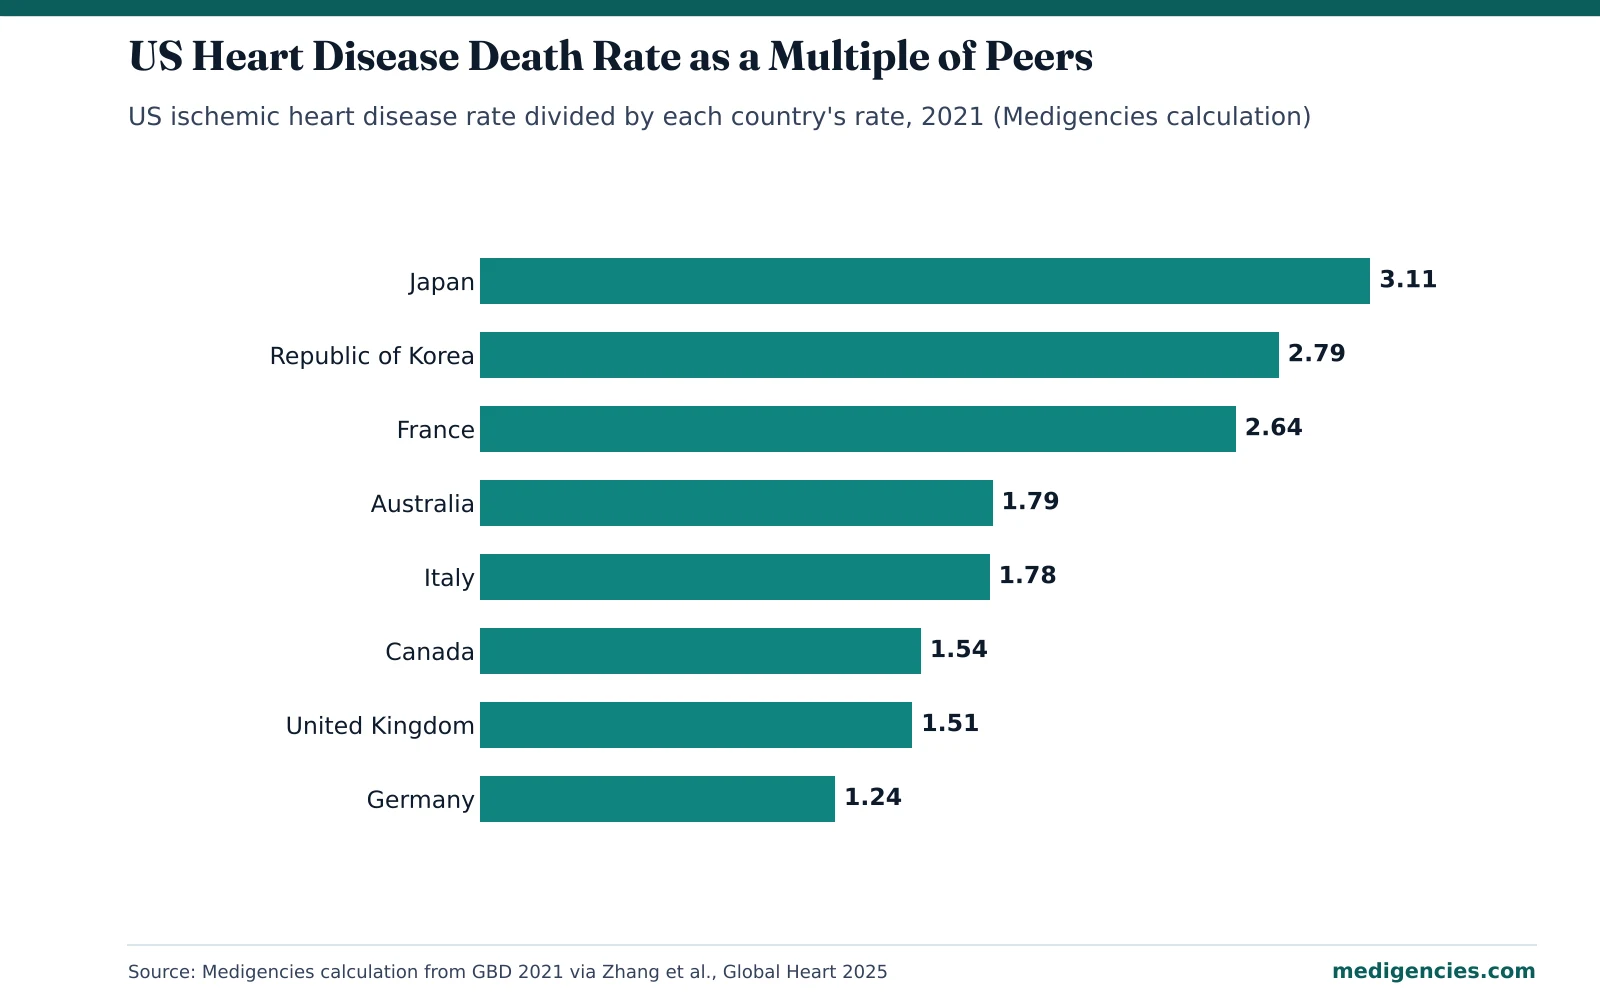
In 1990 the UK (196.49) and Germany (192.40) both had higher rates than the US (179.83). By 2021 both had dropped below it. The eight-peer average fell from 130.03 to 42.34, which took the US from 1.38 times that average to 1.86 times.
The eight peers cut their rates by an average of 65.2% over 31 years. Apply that cut to the 1990 US rate and you get 62.6 for 2021, about 16 deaths per 100,000 below the actual figure. Canada’s rate of decline would have put the US at 58.7. The UK’s would have brought it down to 47.7.
Medigencies takeaway: We read the peer gap as a prevention gap, and it gives a cardiology group a public-health case for screening outreach. Build each campaign around one action, such as a blood pressure check, a lipid panel or a calcium score scan if the practice offers one. Keep country comparisons out of ad copy. They belong on education pages, which have room to explain them.
Thirty Years of Decline, Ranked by Size
All nine high-income G20 countries more than halved their ischemic heart disease death rate between 1990 and 2021. Australia (-74.8%) and the UK (-73.5%) cut the most. The US managed 56.1%, second-smallest of the nine. Only South Korea fell less, and it started from a far lower 60.15.
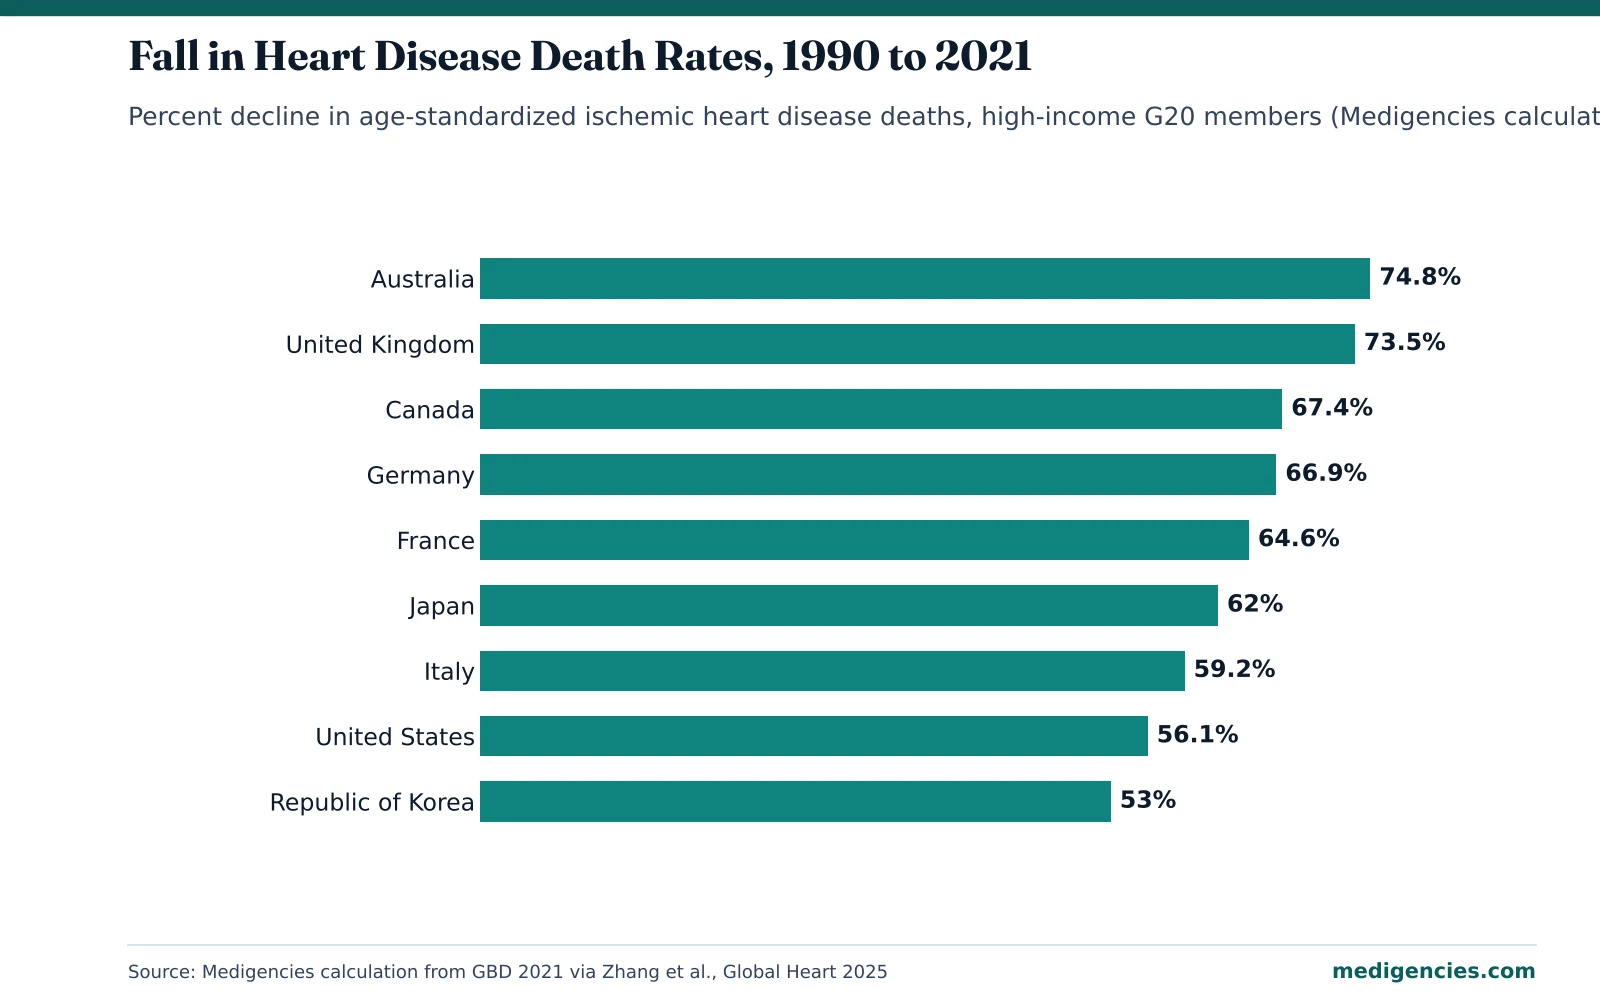
In absolute terms the UK cut 144.4 deaths per 100,000, Australia 131.0 and Germany 128.7. The US cut 100.9, close to Canada’s 105.5. Canada began from a lower 1990 rate, so a similar absolute cut gave it a bigger percentage drop.
Russia’s rate fell 31.6%, from 311.27 to 212.91, but because it started so high it still has the top G20 rate, 2.7 times the US figure.
Over the same years Indonesia’s rate rose 39.1%, China’s went up 17.8% and India’s climbed 9.6%. Mexico went from 113.39 to 113.21, essentially flat for three decades. Turkey and Saudi Arabia did fall, though by less than any high-income country.
Medigencies takeaway: Many US patients were born in, or have family in, countries where these rates are flat or rising. A country rate describes people living in that country, and you can’t read one Houston or Chicago patient’s risk from it. It is still a fair basis for language-specific prevention pages, family-history prompts and health fair partnerships in the neighborhoods your practice serves.
Regional Gaps in the Global Burden of Disease 2022 Data
GBD 2022 splits the world into 21 regions. For all cardiovascular disease, the age-standardized death rate was highest in Eastern Europe at 432.3 per 100,000 and lowest in high-income Asia Pacific at 73.6. We calculate that as a 5.9-fold gap. Worldwide, cardiovascular mortality fell 34.9% between 1990 and 2022.
For ischemic heart disease alone, the table lists selected regions in 2022. Our ratio column compares each one with high-income North America, the region that contains the US.
| GBD region | IHD deaths per 100,000 (2022) | Rank of 21 | Ratio to high-income North America |
|---|---|---|---|
| Central Asia | 268.9 | 1 | 3.55 |
| Eastern Europe | 254.3 | 2 | 3.35 |
| North Africa and Middle East | 196.2 | 4 | 2.59 |
| South Asia | 147.1 | 5 | 1.94 |
| Southeast Asia | 110.7 | 8 | 1.46 |
| Central Latin America | 108.9 | 9 | 1.44 |
| East Asia | 108.4 | 10 | 1.43 |
| Caribbean | 104.6 | 11 | 1.38 |
| Western Sub-Saharan Africa | 94.4 | 12 | 1.25 |
| High-income North America | 75.8 | 15 | 1.00 |
| Western Europe | 49.5 | 19 | 0.65 |
| Australasia | 47.4 | 20 | 0.63 |
| High-income Asia Pacific | 26.0 | 21 | 0.34 |
| Global | 108.8 | 1.44 |
At 75.8, high-income North America sits 30% below the global rate. It is also 53% above Western Europe and nearly three times high-income Asia Pacific. Between Central Asia and high-income Asia Pacific the spread is ten-fold, wider than the gap for cardiovascular disease as a whole.
Medigencies takeaway: Ischemic heart disease rates in South Asia, Eastern Europe, and North Africa and the Middle East run two to three times the North American figure. If your metro area has large communities from those regions, add translated pages on chest pain warning signs and cholesterol testing. A clinician who speaks the language should review each translation, and the page should carry the same review date and reviewer line as the English version.
OECD Comparisons for Heart Attack and Stroke Deaths
Across OECD countries in 2023, ischemic heart disease caused 11% of all deaths, an average of 112 per 100,000. Luxembourg, the Netherlands, France, Japan and Korea had rates below 40. Six members topped 250, namely Colombia, Latvia, Mexico, the Slovak Republic, Hungary and Lithuania.
Between 2013 and 2023 the average dropped by 27 deaths per 100,000, yet Mexico, Colombia and Poland each saw rises of more than 30%. Stroke caused 6% of deaths and fell in every member country, by 28% on average.
Men’s circulatory disease mortality runs 46% higher than women’s across the OECD, and cardiovascular disease typically develops 5 to 10 years earlier in men. Heart attack care has improved too. Average 30-day mortality after a heart attack was 6.5% in 2023, down from 8.2% in 2013.
Medigencies takeaway: Start men’s heart-risk outreach earlier than women’s, in their 40s for example, to match the earlier onset. Women still need their own heart pages, because cardiovascular disease accounts for 34% of women’s deaths across OECD countries and 32% of men’s. OECD and GBD use different methods, so quote each on its own and keep them out of the same comparison.
Heart Disease Figures Inside the United States and the Americas
Heart disease killed 683,491 people in the US in 2024, more than any other cause. Its age-adjusted death rate dropped 2.8%, from 162.1 per 100,000 in 2023 to 157.6.
That CDC rate is roughly double the GBD figure for the US. CDC counts all heart disease, where the GBD number above is ischemic heart disease only. CDC also age-adjusts to the US 2000 standard population, which is older than the world standard used for international comparison. Quote CDC for US trends and GBD for country rankings.
In the Americas, the age-standardized cardiovascular death rate fell 29.8%, from 208.0 per 100,000 in 2000 to 146.1 in 2021. Haiti was highest in the region at 427.7 and Canada lowest at 80.1. By our calculation, Haiti’s rate is 5.3 times Canada’s.
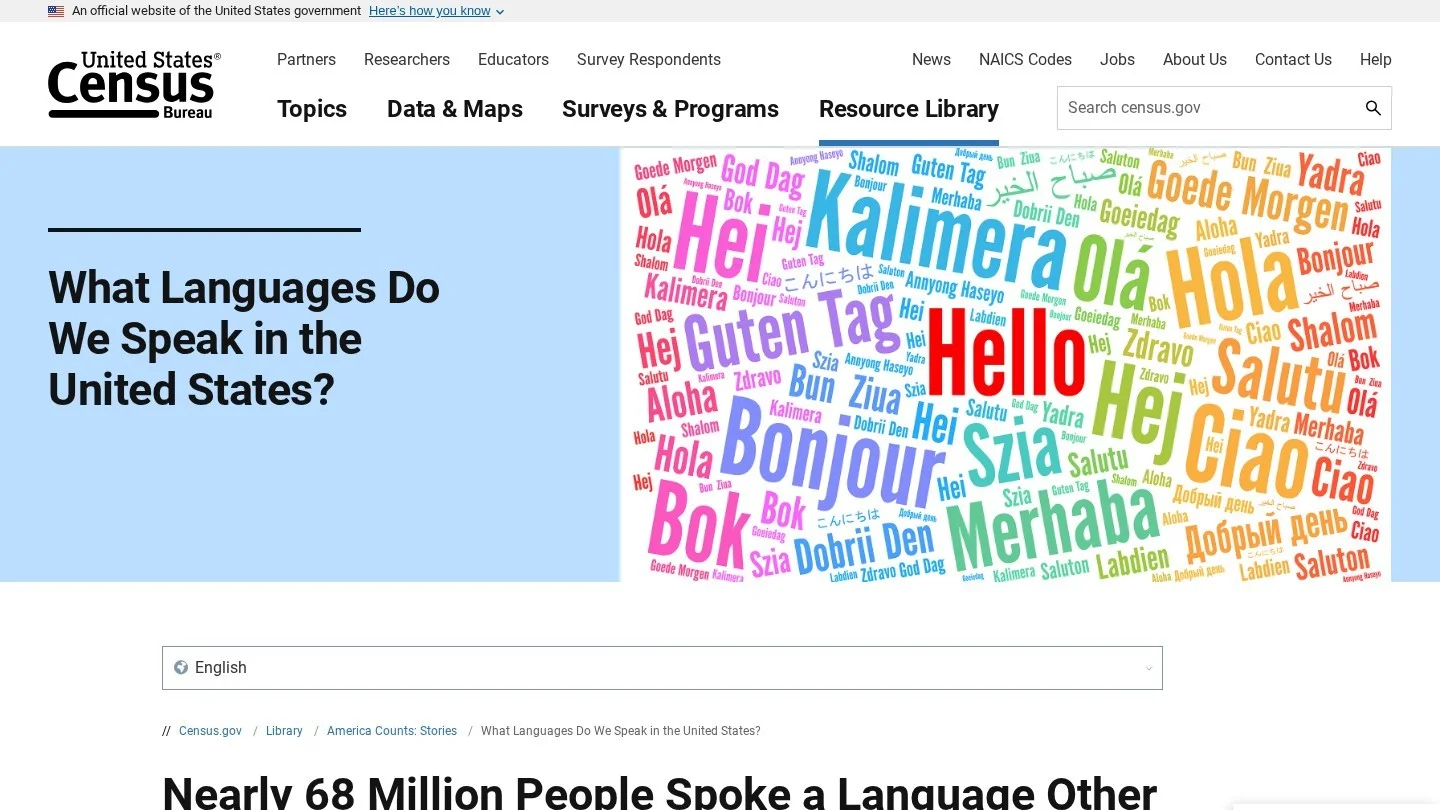
In 2019, 67.8 million US residents spoke a language other than English at home, nearly triple the 23.1 million in 1980. Spanish speakers made up 62% of that group, about 42 million people by our math.
Medigencies takeaway: For most US cardiology groups, the first translated pages should be Spanish heart-risk pages. Mexico’s ischemic heart disease rate has not fallen in 30 years, and on the OECD measure it rose more than 30% between 2013 and 2023. Pages on blood pressure and heart attack symptoms, with Spanish-speaking schedulers on the phone, reach the largest non-English language group in the country. Pick the next language from your own patient intake data.
A Campaign Plan Built From the Country Numbers
Each row turns one finding into a campaign decision for a US cardiology practice. The calls are ours, written for clinics and the agencies that run their marketing.
| Finding | Who to reach | Message | Channel | Avoid |
|---|---|---|---|---|
| US rate is 1.86 times the high-income peer average | Adults 40 and older without a cardiologist | Know your blood pressure, cholesterol and blood sugar numbers | Search ads on screening terms, education pages, primary care partnerships | Country-to-country comparisons in ad copy |
| CVD develops 5 to 10 years earlier in men | Men in their 40s and early 50s | Book a heart risk check before symptoms start | Employer health events, local search, email to existing patients who opted in | Fear-based imagery or “silent killer” headlines |
| Mexico’s rate flat since 1990 | Spanish-speaking households | Heart attack warning signs and free or low-cost screening dates | Spanish pages, Spanish radio and community clinics | Machine translation without clinician review |
| South Asia rate 1.94 times North America’s | South Asian communities in your service area | Family history, cholesterol testing and diet guidance | Community and faith-center health fairs, translated handouts | Implying any individual’s risk from their ancestry alone |
| 30-day heart attack deaths fell to 6.5% (OECD, 2023) | Patients after a heart attack and their families | Cardiac rehab and follow-up visits | Discharge packets, patient portal messages | Promising specific survival outcomes |
A Bilingual Heart-Risk Page, Section by Section
The first bilingual pair we’d have a cardiology group publish is a heart-risk page in Spanish and English. Each version gets its own URL, hreflang tags connect the two, and both name the same physician reviewer. The sections run in this order.
- An opening line listing heart attack warning signs and telling the reader to call 911.
- Numbers to know, starting with blood pressure and LDL cholesterol, with one line of explanation for each.
- A prompt asking whether a parent or sibling had heart disease at a young age.
- Screening dates and places, plus a phone line answered in the page’s language.
- The reviewing cardiologist’s name and the date of the last review.
One sourced national figure, such as the 683,491 US heart disease deaths in 2024, gives a patient all the context they need.
Google’s Health in personalized advertising policy covers ads about health conditions and treatments, so it applies to these campaigns. Those ads can’t use customer match, your data segments, audience expansion or lookalike segments. Predefined Google audiences such as demographics and location still work, with some exceptions. Our guide to Google’s healthcare ad rules goes through the other restrictions.
A screening campaign should get someone booked in as few steps as possible. Our cardiologist marketing guide covers heart scan pages and the reminder messages that get booked patients through the door. Condition pages and medical review are in our cardiology SEO guide, and groups that do procedures can borrow the page plan in SEO for interventional cardiology practices.
Reading Country Heart Statistics Without Mixing Methods
Most gaps between sources trace back to the cause group. Ischemic heart disease, all heart disease and all cardiovascular disease are different totals. Age adjustment is the other big factor, because an older standard population produces higher rates.
We kept every comparison inside one source. GBD rounds never mix, since each round revises the earlier estimates, so the G20 rankings come from a single GBD 2021 table and the regional ratios from a single GBD 2022 table. OECD, WHO and CDC numbers stand on their own terms. Every derived figure was calculated in Python from the published values and rounded to one or two decimals.
If you publish statistics pages of your own, hold to the same rule. Ad-side benchmarks are in our healthcare PPC statistics. For medically reviewed content, compare firms on our healthcare content marketing agencies list or the cardiology marketing agencies directory. Search specialists for heart practices are on our cardiology SEO agencies page.
Questions About Heart Disease Rates Around the World
Which Country Has the Highest Heart Disease Death Rate?
Russia had the highest G20 rate in 2021, at 212.91 age-standardized ischemic heart disease deaths per 100,000. Among GBD regions in 2022, Central Asia was highest at 268.9.
Which Country Has the Lowest Heart Disease Death Rate?
Japan had the lowest G20 rate in 2021, at 25.36, with South Korea (28.27) and France (29.87) close behind. High-income Asia Pacific was the lowest GBD region in 2022.
How Does the US Compare With Other Developed Countries?
The US does worse than every high-income G20 peer on this measure. Its 2021 rate of 78.92 was the highest of the nine and 1.86 times the average of the other eight, by our calculation from GBD 2021 values.
Is Heart Disease Still the Top Cause of Death in the US?
Yes. Heart disease caused 683,491 US deaths in 2024, more than any other cause, at an age-adjusted rate of 157.6 per 100,000.
Has Heart Disease Mortality Fallen Worldwide?
Yes, once rates are age-standardized. The global ischemic heart disease death rate dropped 31.6% between 1990 and 2021, and cardiovascular mortality overall fell 34.9% from 1990 to 2022. China, India and Indonesia were among the large countries where rates rose anyway.
Why Do Different Sources Give Different Rates for the Same Country?
They count different cause groups and age-adjust to different standard populations. Compare countries within a single source, and put the source and data year beside every figure you quote.
Mortality Datasets and Studies Behind These Figures
- Zhang Y. et al., Trends and Projections of Burden of Ischemic Heart Disease in China Versus Other G20 Countries, Global Heart 20(1):37 (2025), GBD 2021 data
- Global Burden of Cardiovascular Diseases and Risks Collaboration, Cardiovascular Disease in All Regions: Findings From the Global Burden of Disease Study (2022 data)
- Mensah G.A. et al., Global Burden of Cardiovascular Diseases and Risks, 1990-2022, JACC 82:2350-2473 (2023), summary
- OECD, Health at a Glance 2025: Mortality From Circulatory Diseases (2023 data)
- OECD, Health at a Glance 2025, full report (PDF)
- Pan American Health Organization, Cardiovascular Disease Burden in the Americas (WHO Global Health Estimates, 2000 to 2021)
- CDC National Center for Health Statistics, Mortality in the United States, 2024, Data Brief No. 548 (January 2026)
- US Census Bureau, America Counts Story on Languages Spoken at Home, 2019 Data (Dec. 6, 2022)
- Google Ads, Health in Personalized Advertising
Compare Agencies for This Topic
Cardiology Marketing AgenciesHealthcare Content Marketing AgenciesHealthcare SEO Agencies
More From the Blog

Guides
Cataract Surgery Center SEO: The Complete Guide
A full SEO guide for cataract surgery centers, from keywords and technical fixes to lens pages, Business Profiles, directories, links, AI citations, reviews and…
Nov 4, 2026

Guides
Interventional Cardiology SEO Guide for Cath Lab and Structural Heart Programs
A full SEO guide for interventional cardiology groups, from keyword research and technical fixes to procedure pages, Business Profiles, citations, links, AI search, reviews…
Nov 4, 2026

Statistics
Childhood Cancer Survival Rate Statistics
Childhood cancer survival rates by type, age and decade, with Medigencies calculations and guidance on communicating survival data ethically to families.
Nov 4, 2026