About 85% of US children with cancer now survive 5 years or more. In the mid-1970s it was about 58%. By our calculation, the share of children who die within 5 years of diagnosis has fallen to about 15% from 42%, a drop of 64%.
The figure varies a great deal with the type of cancer and the child’s age. For young people diagnosed in the US between 2009 and 2015, 5-year relative survival was 99.5% for thyroid carcinoma and 59.8% for a group of brain tumors called other gliomas. Where a child lives also matters. In high-income countries 80% or more of children with cancer survive, and in low- and middle-income countries fewer than 30% do.
What Survival Looks Like for Children With Cancer Today
- The US childhood cancer death rate fell 57% between 1975 and 2022, to 2.2 per 100,000 after 5.1 (our calculation from NCI rates).
- Five-year survival for childhood acute lymphoblastic leukemia rose to 92.3% in 2014 to 2020, after 57% in 1975.
- Across cancer types, 5-year survival in US children and teens spans about 40 percentage points.
- Teens fare worse than younger children for several cancers, including lymphoid leukemia, Ewing sarcoma and rhabdomyosarcoma.
- For every new diagnosis expected in a year, the US had about 33 survivors of childhood cancer, by our calculation.
- WHO aims to lift global childhood cancer survival to at least 60% by 2030, double today’s rate in poorer countries.
How Childhood Cancer Survival Has Changed Since the 1970s
Five-year survival in the mid-1970s was 58% for children aged 0 to 14 and 68% for adolescents aged 15 to 19. For children diagnosed between 2013 and 2019, it ranged between 83.2% for babies under 1 and 87.8% for children aged 1 to 4. Teens aged 15 to 19 reached 87.3%.
The same climb appears in 45 years of SEER data for patients under 20. Five-year survival was 63.1% for those diagnosed in 1975 to 1979 and 85.2% for those diagnosed in 2010 to 2019. Ten-year survival rose to 82.7%, up from 58.8%.
Deaths fell as survival rose. The cancer death rate for Americans under 20 dropped to 2.2 per 100,000 in 2022, down from 5.1 in 1975, a 57% decline by our calculation. Even so, cancer remains the most common cause of death by disease among US children past infancy. About 1,600 children and teens die of it each year.

| Measure | Earlier period | Latest period | Medigencies calculation |
|---|---|---|---|
| 5-year survival, all childhood cancers | About 58% (mid-1970s) | About 85% (now) | Deaths within 5 years down 64% |
| 5-year survival, under 20, SEER | 63.1% (1975 to 1979) | 85.2% (2010 to 2019) | +22.1 points |
| 10-year survival, under 20, SEER | 58.8% (1975 to 1979) | 82.7% (2010 to 2019) | +23.9 points |
| Acute lymphoblastic leukemia, children | 57% (1975) | 92.3% (2014 to 2020) | +35.3 points; deaths within 5 years down 82% |
| Non-Hodgkin lymphoma, children | 43% (1975) | 91.4% (2014 to 2020) | +48.4 points; deaths within 5 years down 85% |
| All leukemias, under 20 | 48.2% (1975 to 1979) | 85.1% (2010 to 2019) | +36.9 points |
| All lymphomas, under 20 | 72.9% (1975 to 1979) | 94.2% (2010 to 2019) | +21.3 points |
| Cancer death rate, under 20 | 5.1 per 100,000 (1975) | 2.2 per 100,000 (2022) | Down 57% |
Parents searching after a diagnosis often land on old numbers. A children’s hospital can publish current survival figures with the period and source named, and for most families those figures are more hopeful than the ones they found first. When you use the term “5-year survival”, explain it in one sentence. Some parents read it as a limit of five years of life.
Five-Year Survival by Type of Childhood Cancer
Thyroid carcinoma had the highest 5-year relative survival among US patients under 20 diagnosed between 2009 and 2015, at 99.5%. Hodgkin lymphoma followed at 97.3% and gonadal germ cell tumors at 96.4%. At the other end, other gliomas were at 59.8%, intracranial embryonal tumors at 64.9% and rhabdomyosarcoma at 65.3%.
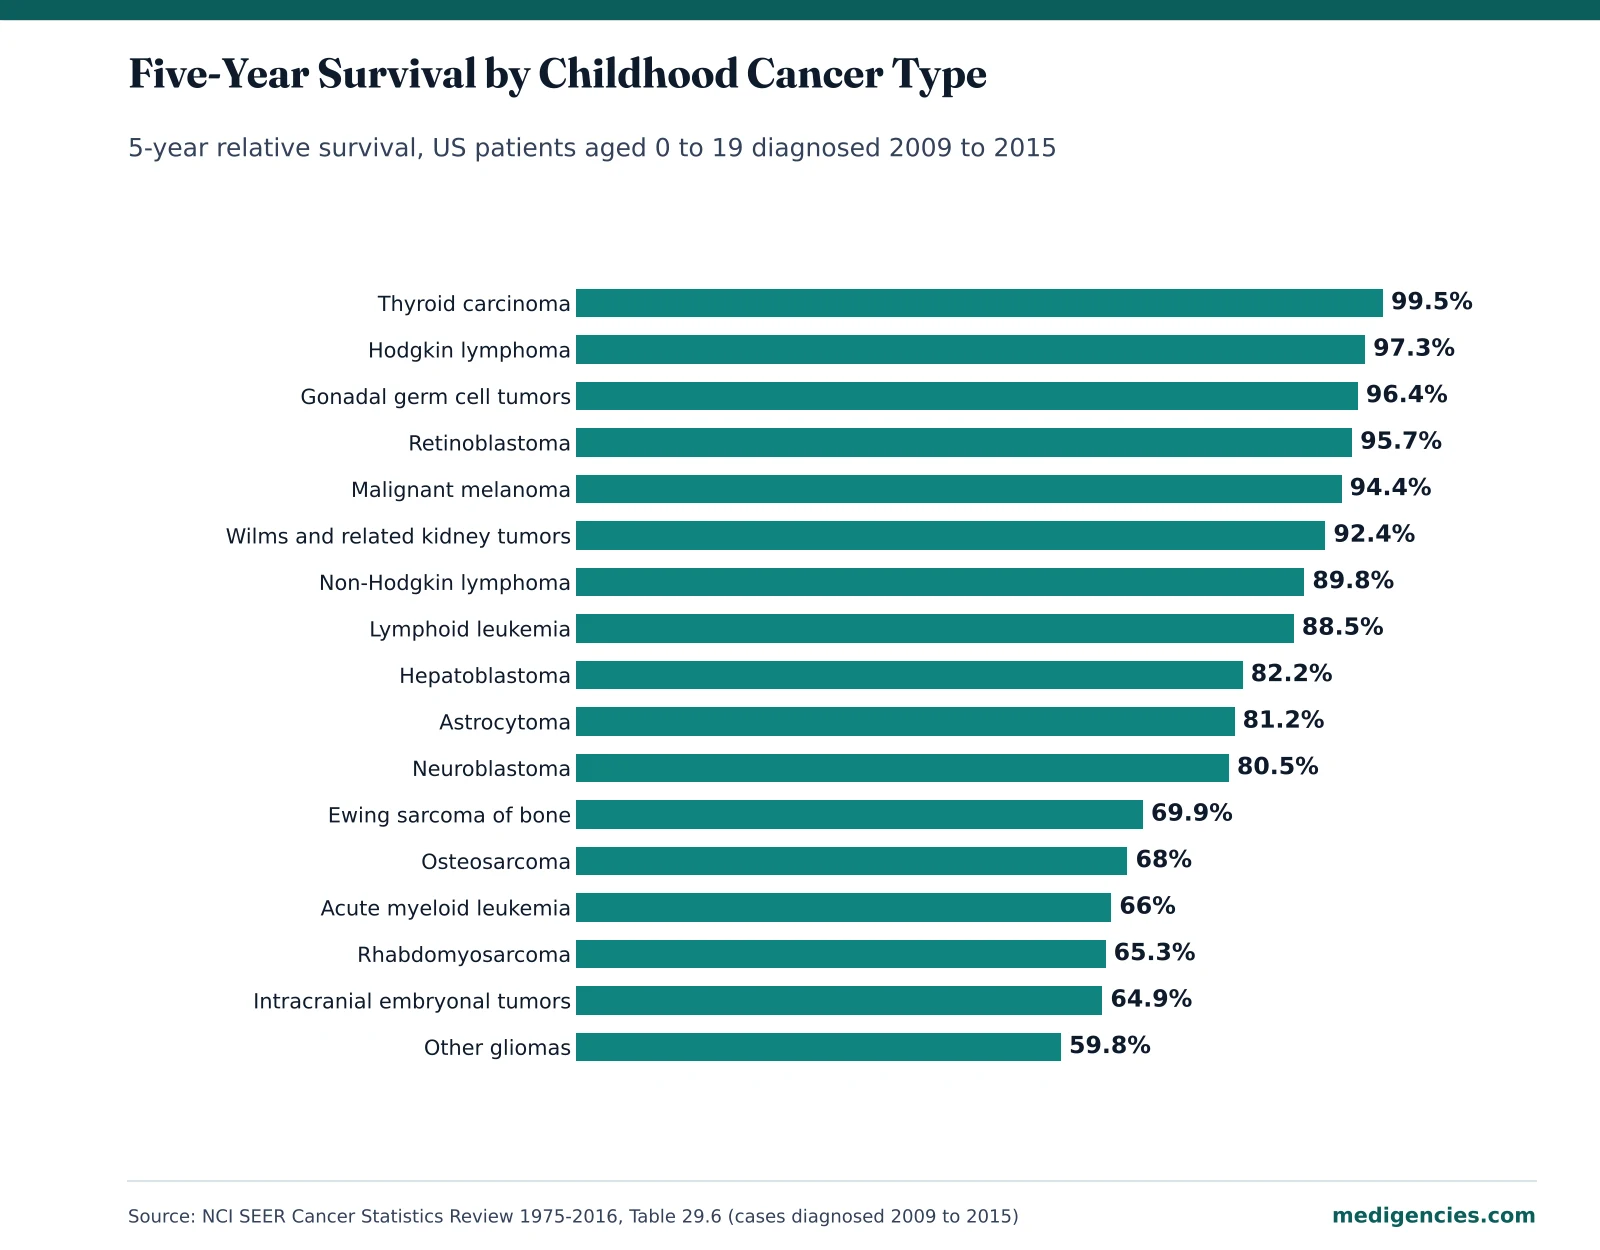
The highest and lowest groups are 39.7 percentage points apart by our count. Subtype matters even within leukemia. Lymphoid leukemia reached 88.5% while acute myeloid leukemia sat at 66.0%, a 22.5-point gap inside one family of cancers.
| Cancer type | Ages 0 to 19 | Ages 0 to 14 | Ages 15 to 19 |
|---|---|---|---|
| Thyroid carcinoma | 99.5% | 99.8% | 99.4% |
| Hodgkin lymphoma | 97.3% | 98.4% | 96.7% |
| Retinoblastoma | 95.7% | 95.7% | Too few cases |
| Malignant melanoma | 94.4% | 94.7% | 94.5% |
| Wilms tumor and related kidney tumors | 92.4% | 92.6% | Too few cases |
| Non-Hodgkin lymphoma | 89.8% | 90.8% | 88.3% |
| Lymphoid leukemia | 88.5% | 90.7% | 74.1% |
| Hepatoblastoma | 82.2% | 82.5% | Too few cases |
| Astrocytoma | 81.2% | 82.8% | 75.4% |
| Neuroblastoma | 80.5% | 81.2% | Too few cases |
| Ewing sarcoma of bone | 69.9% | 76.3% | 57.5% |
| Osteosarcoma | 68.0% | 69.0% | 66.6% |
| Acute myeloid leukemia | 66.0% | 65.9% | 66.3% |
| Rhabdomyosarcoma | 65.3% | 70.5% | 44.9% |
| Intracranial embryonal tumors | 64.9% | 64.6% | 67.5% |
| Other gliomas | 59.8% | 53.9% | 83.8% |
| All childhood cancers combined | 84.1% | 83.7% | 85.0% |
Putting the overall 85% figure on a brain tumor page would set the wrong expectation, and a parent will notice. Give each condition page its own survival figure and period. Add a note that the child’s care team can speak to their individual outlook, and a clear path to the clinic that treats that cancer. For cancers with lower survival, give clinical trials and family support more room on the page.
How Age at Diagnosis Changes the Outlook
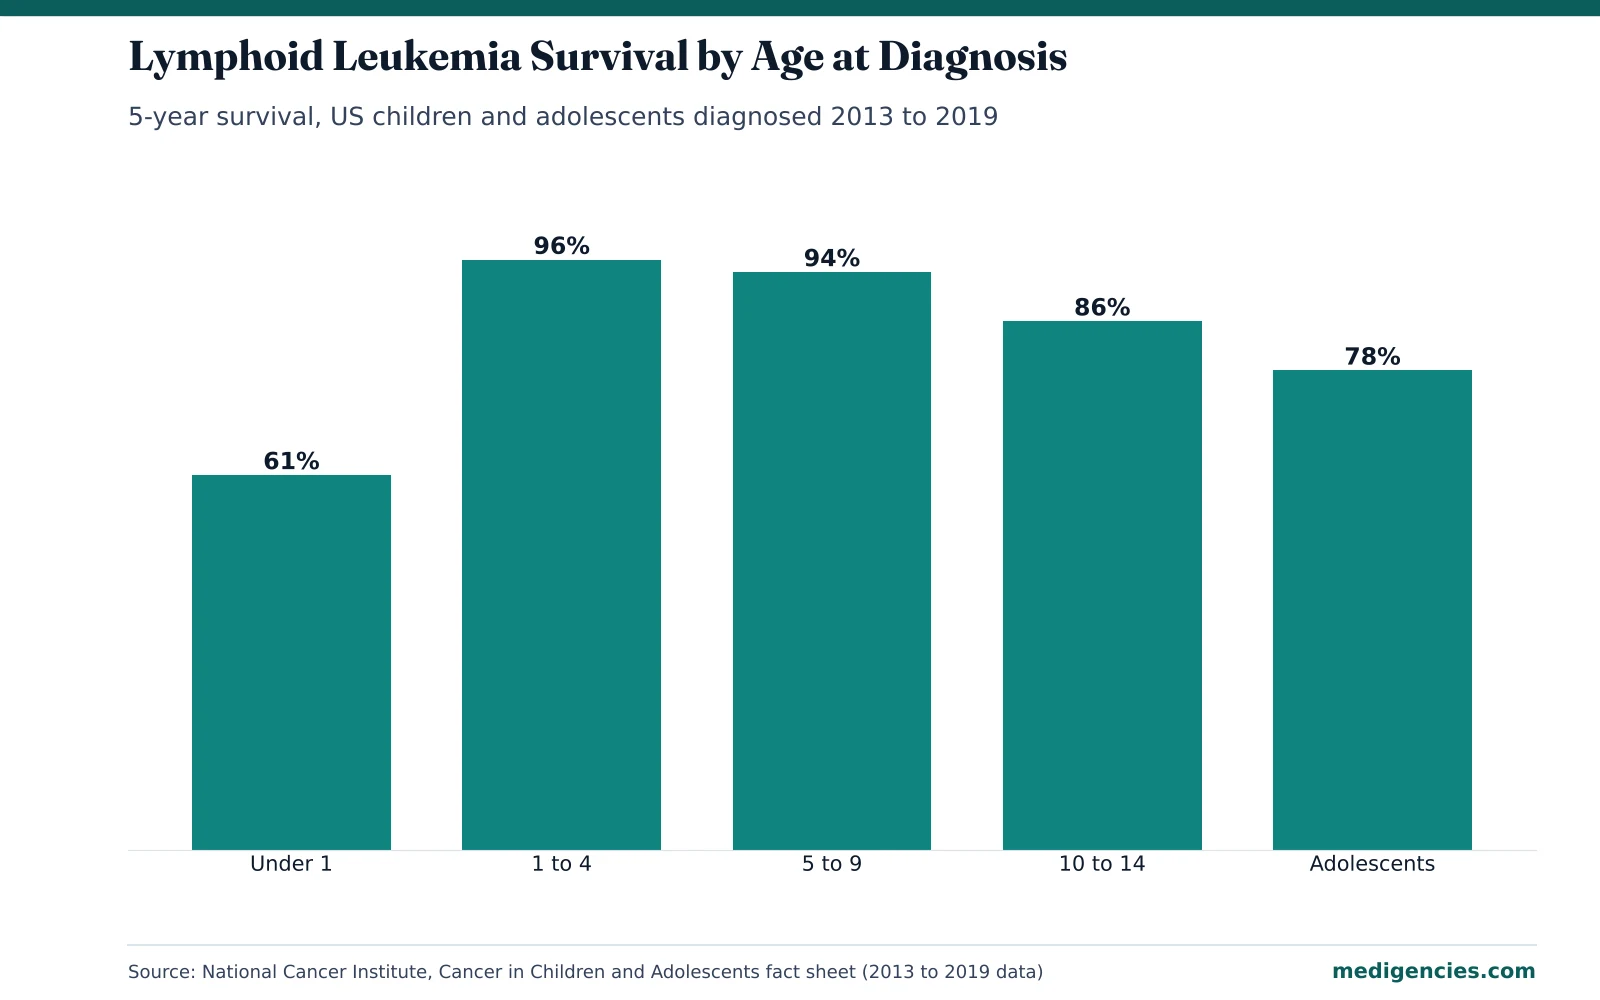
Lymphoid leukemia survival for children diagnosed between 2013 and 2019 was 96% at ages 1 to 4 and 94% at ages 5 to 9. It dropped to 86% at ages 10 to 14 and 78% for adolescents. Babies under 1 had the lowest figure, at 61%.
Sarcomas have a teen gap too. Ewing sarcoma survival was over 80% for ages 1 to 14 in 2013 to 2019, against 69% for adolescents. In the 2009 to 2015 SEER table, rhabdomyosarcoma survival was 70.5% for children under 15 and 44.9% for teens, a 25.6-point gap by our maths.
Across all cancers, teens do about as well as younger children, with 87.3% survival in 2013 to 2019. The gap appears only within particular cancers. Of the 14,910 new cancer cases expected in Americans under 20 in 2024, 5,290 were in adolescents aged 15 to 19, or 35.5% by our calculation.
Teens with cancer read the website themselves. Give them a page of their own, written in plain language for adolescents and young adults, about school and what treatment will feel like. Short videos from teen patients who choose to tell their story speak to this group directly, and each one needs a parent’s signed authorization first. Our list of healthcare social media agencies includes teams used to handling sensitive content like this. On leukemia and sarcoma pages, tell families that age affects outlook and that the care team will explain what it means for their child.
The Survival Gap Between Rich and Poor Countries
An estimated 400,000 children and adolescents aged 0 to 19 develop cancer worldwide each year. In high-income countries 80% or more survive, against fewer than 30% in low- and middle-income countries. By our calculation, a child in a high-income country is about 2.7 times as likely to survive.

WHO launched the Global Initiative for Childhood Cancer in 2018 with a target of at least 60% survival by 2030. For low- and middle-income countries, that means roughly doubling the current rate.
In CONCORD-3, the global cancer survival study covering patients diagnosed between 2000 and 2014, the size of the gap depends on the cancer. Five-year survival for childhood acute lymphoblastic leukemia was above 90% in Canada, the US and nine European countries. It stayed below 60% in China, Mexico and Ecuador. For childhood brain tumors diagnosed in 2010 to 2014, survival was below 40% in Brazil and Mexico and around 80% in Sweden, Denmark and Slovakia.
| Measure | Higher-survival settings | Lower-survival settings | Gap |
|---|---|---|---|
| All childhood cancers | 80% or more (high-income countries) | Under 30% (low- and middle-income countries) | At least 50 points; about 2.7 times |
| Acute lymphoblastic leukemia, children | Over 90% (Canada, US, nine European countries) | Under 60% (China, Mexico, Ecuador) | More than 30 points |
| Brain tumors, children, 2010 to 2014 | About 80% (Sweden, Denmark, Slovakia) | Under 40% (Brazil, Mexico) | About 40 points |
| Leukemia, ages 0 to 24, 2010 to 2014 | Over 85% (Canada, Cyprus, Belgium, Denmark, Finland, Australia) | 46% (Mexico) | About 40 points |
| WHO target for 2030 | At least 60% survival worldwide | About double today’s rate in poorer countries | |
A US hospital with an international patient office should spell out how to request a records review and which languages its staff speak. Leave out comparisons that suggest care in a family’s home country is hopeless. Some families from the countries in this table may already live nearby, so parent pages in Spanish and other languages matter.
Childhood Cancer Survivors and Late Effects
About 495,739 people diagnosed with cancer before age 20 were alive in the US on January 1, 2020. Against the 14,910 new cases expected in 2024, that is about 33 survivors for every new diagnosis, by our calculation.
Many survivors face serious health problems later in life. In a cohort treated between 1970 and 1986, more than half had a severe or disabling complication, or had died, by age 50. Conditional life expectancy for childhood cancer survivors is 15% to 25% lower than for their peers, and the gap is larger for people treated with radiotherapy.
A small number of deaths still occur after the 5-year mark. For patients under 20 diagnosed in 2010 to 2019, 5-year survival was 85.2% and 10-year survival 82.7%, a 2.5-point difference. Follow-up care needs to run well past year five.
About 9,680 US children aged 0 to 14 will be diagnosed with cancer in 2026. For all Americans under 20, 1,590 deaths were expected against 14,910 new cases in 2024, about 11 deaths for every 100 diagnoses in a single year by our calculation.
Survivors outnumber new patients about 33 to 1, and many are now adults who no longer see a pediatrician. Write the survivorship clinic page for adults treated as children. List the follow-up checks the clinic offers and say how to book without a pediatric referral. Pages on going back to school and returning to sport keep families in touch with the program for years.
How Pediatric Oncology Programs Can Communicate Survival Data Ethically
More than 220 children’s hospitals, universities and cancer centers belong to the Children’s Oncology Group. Its member institutions care for more than 80% of US children and adolescents diagnosed with cancer, and most children treated at these centers take part in a clinical trial. Parents are encouraged to ask about trials and to consider a second opinion.
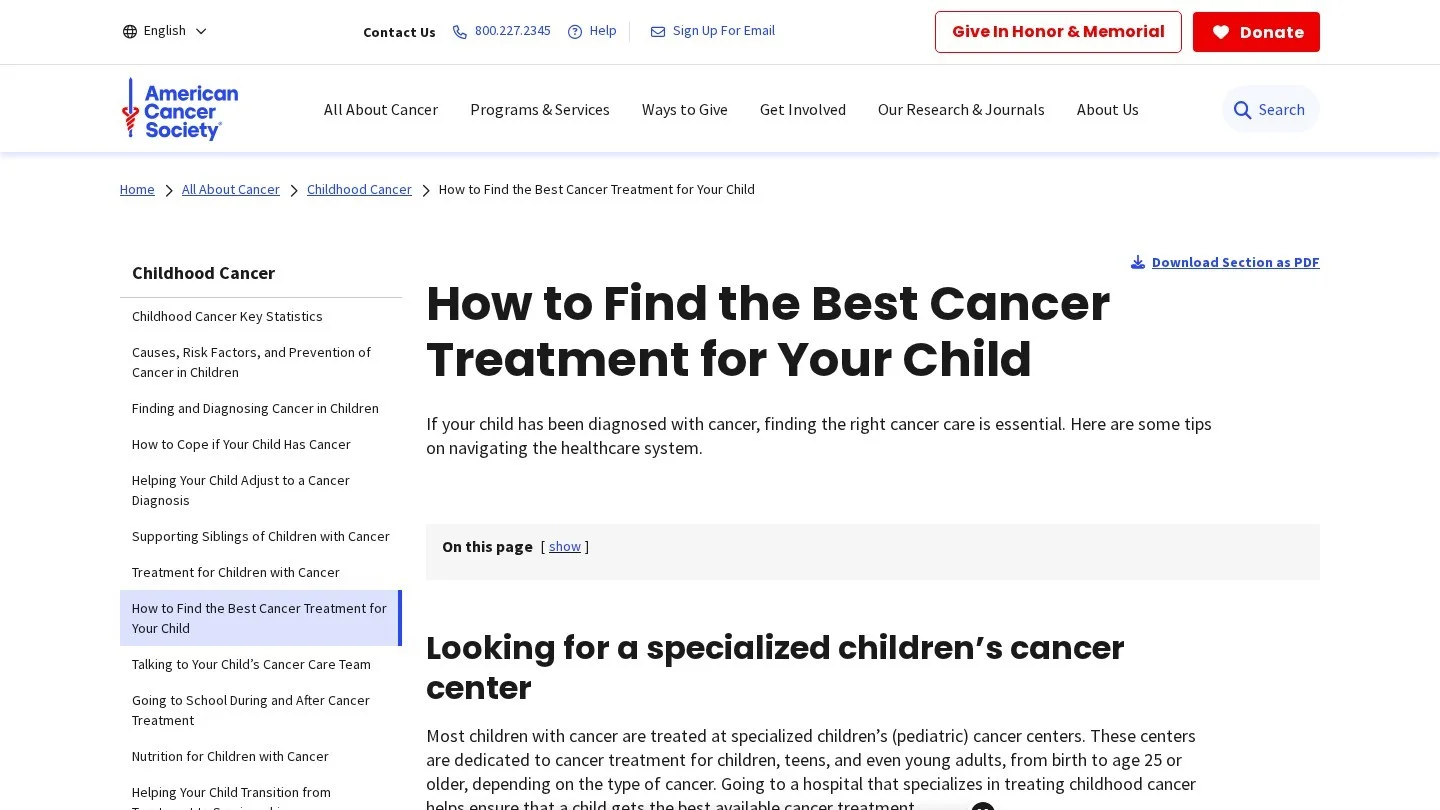
Put clinical trials near the top of a pediatric oncology site. The trials page should list open studies by cancer type and age, with a named contact. Say in plain words what taking part involves for a child and family. Our oncology marketing agencies and pediatrics marketing agencies include teams that build this kind of content.
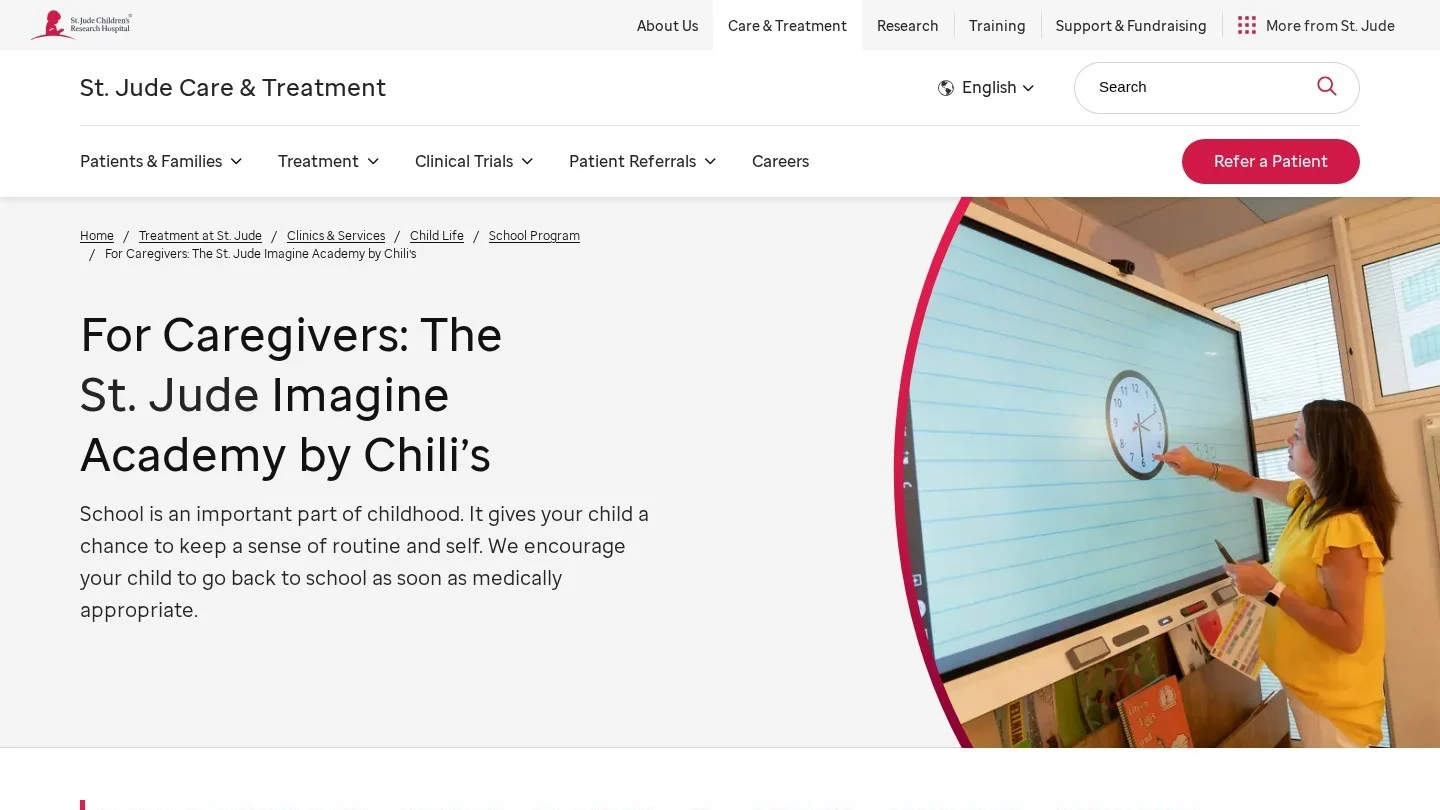
St. Jude Children’s Research Hospital publishes a school program guide for parents that explains how children keep up with schoolwork during treatment. A hospital without its own school program can still write a page on how teachers and the care team share updates.
Under the HIPAA Privacy Rule, a covered entity generally needs a person’s written authorization before using their protected health information for marketing. For a child, that means a signed authorization from a parent or guardian before any story, photo or video runs. A story describing an outcome better than most families can expect also needs the generally expected result alongside it, under FTC endorsement guidance.
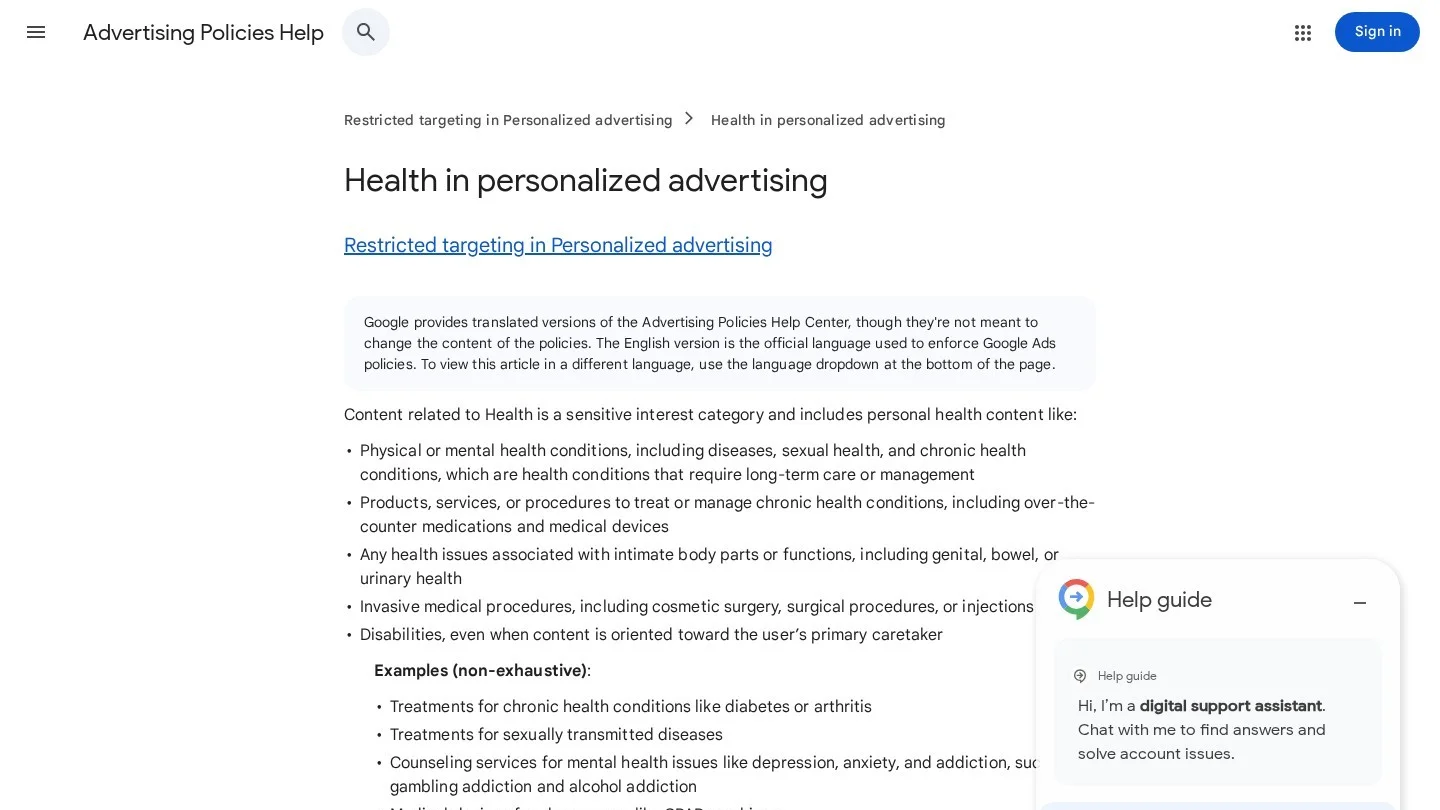
Google treats health conditions as a sensitive category for personalized ads. Customer Match, your data segments and lookalike segments are off the table for these campaigns. The details are in our guide to Google’s healthcare ad rules, and programmatic advertising in healthcare explains the limits on display buying.
| Topic | Write it this way | Avoid |
|---|---|---|
| Survival figures | “For children diagnosed with ALL in 2014 to 2020, 5-year survival was 92.3%.” | “Over 90% cured” or a single figure for every cancer |
| Hope and outcomes | Current data, the period, and a note that the care team will explain each child’s outlook | Fear lines such as “Every minute counts” in ads |
| Patient stories | Signed parent or guardian authorization; the family’s own words | Stories that imply every child will have the same result |
| Clinical trials | Open trials by type and age, a named contact, plain-language consent steps | Calling a trial a “breakthrough cure” |
| Fundraising | Separate pages and appeals from care information | Mixing donation asks into treatment pages |
| Survivors | Long-term follow-up clinic pages for adults treated as children | Ending the story at the last day of treatment |
Let families describe the illness in their own words. Hospital copy should leave out battle language unless a family uses it in its own story. Count second-opinion inquiries and trial referrals, which tell you whether the content reaches parents at the right moment. Hospitals that want outside support can compare hospital and health system marketing agencies with specialist healthcare content marketing agencies. Our list of healthcare reputation management agencies covers review and story programs. Our editorial policy explains how we handle health data.
Questions Parents Ask About Childhood Cancer Survival
What Is the Survival Rate for Childhood Cancer?
About 85% of US children with cancer survive 5 years or more. For those diagnosed between 2013 and 2019, 5-year survival by age band ranged between 83.2% and 87.8%.
Which Childhood Cancer Has the Highest Survival Rate?
Thyroid carcinoma had 99.5% 5-year relative survival in US patients under 20 diagnosed between 2009 and 2015. Hodgkin lymphoma was at 97.3% and retinoblastoma at 95.7%.
Which Childhood Cancers Have Lower Survival Rates?
Some brain tumors, sarcomas and acute myeloid leukemia had 5-year survival in the 60% range or below for 2009 to 2015. Other gliomas were lowest at 59.8%.
How Much Has Childhood Cancer Survival Improved?
Five-year survival is now about 85%, up from about 58% in the mid-1970s. The death rate for Americans under 20 fell 57% between 1975 and 2022.
Do Teenagers Have Lower Survival Than Younger Children?
For some cancers, yes. Lymphoid leukemia survival was 78% for adolescents against 96% for children aged 1 to 4 in 2013 to 2019. Across all cancers combined, survival for teens is similar to that of younger children.
SEER Tables, NCI and WHO Pages Used for These Survival Figures
- National Cancer Institute, Cancer in Children and Adolescents
- NCI SEER Cancer Statistics Review 1975 to 2016, Table 29.6: 5-Year Relative Survival by ICCC Group, Sex and Age (2009 to 2015)
- Sultan et al., Trends in Childhood Cancer: Incidence and Survival Analysis Over 45 Years of SEER Data, PLoS ONE (2025)
- NCI Division of Cancer Control and Population Sciences, SEER Data Shed Light on Long-Term Survival After Childhood and Adolescent Cancer
- American Cancer Society, Key Statistics for Childhood Cancers
- American Cancer Society, How to Find Childhood Cancer Treatment
- World Health Organization, Improving Childhood Cancer Cure Rate
- London School of Hygiene and Tropical Medicine, CONCORD-3 Global Cancer Survival Findings (Lancet, 2018)
- Worldwide Trends in Population-Based Survival for Children, Adolescents and Young Adults Diagnosed With Leukaemia, 2000 to 2014 (CONCORD-3), Lancet Child and Adolescent Health (2022)
- St. Jude Children’s Research Hospital, School Program for Parents
- HHS, HIPAA Privacy Rule Guidance on Marketing
- Federal Trade Commission, FTC’s Endorsement Guides: What People Are Asking
- Google Ads, Health in Personalized Advertising
Compare Agencies for This Topic
Oncology and Cancer Center Marketing AgenciesPediatric Marketing AgenciesHealthcare Content Marketing Agencies
More From the Blog

Statistics
Private Hospital vs Public Hospital Cost Statistics
Hospital costs by ownership in the US, India and the UK, with our own ratios, growth rates and price-page advice for hospital marketers.
Nov 5, 2026

Statistics
Healthcare Mobile Search Statistics
Smartphone ownership, online health lookups by age, portal app use, telemedicine and page speed limits, with our own per-1,000-adults model for clinics.
Nov 5, 2026

Statistics
Healthcare Digital Marketing ROI Statistics
Hospital ad effects, health system marketing budgets, cost per patient by channel and Google's return claim, with our own math for clinics and hospitals.
Nov 5, 2026