
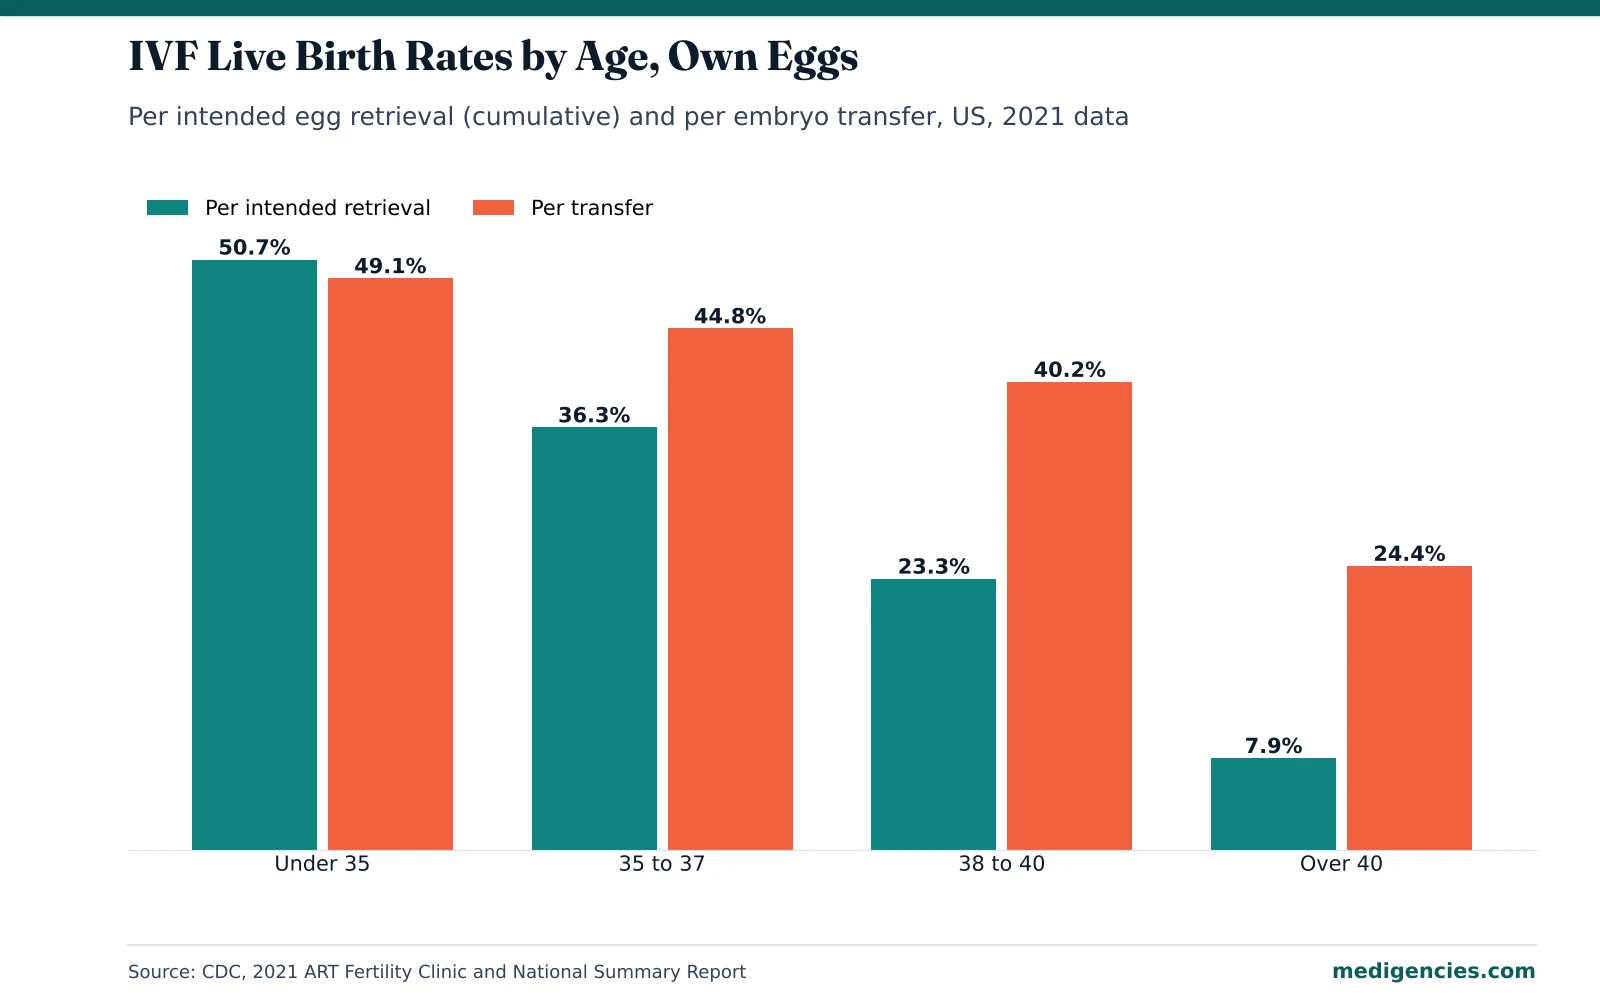
About half of US IVF patients under 35 who start a cycle with their own eggs take home a baby from it. In 2021, 50.7% of intended egg retrievals in that age group ended in a live birth, counting every embryo transfer within a year of the retrieval. At 35 to 37 the rate was 36.3%, and it fell to 23.3% at 38 to 40 and to 7.9% over 40.
A fertility clinic should plan its age targeting and its published success claims around those four rates. We ran our own calculations on the national counts and wrote down what each result means for a clinic’s pages and ad budget.
Five Age Facts for Fertility Clinic Marketing
- A patient over 40 has an 84% lower chance of a live birth per intended retrieval than a patient under 35 (7.9% against 50.7% in 2021).
- Per-transfer rates make the over-40 group look about three times better than per-retrieval rates, because only 32 transfers happen for every 100 cycles started.
- Patients aged 38 and over started 41% of own-egg cycles but had only about 20% of the live births, by our estimate.
- Multiply a one-cycle rate out to six cycles and you overstate real cumulative success by 22 to 23 points, going by a UK study of 156,947 women.
- SART’s advertising policy requires live births per intended retrieval to be shown first, with a link to the clinic’s SART report.

IVF Live Birth Rates by Age Group in the CDC National Data
US clinics reported 413,776 ART cycles for 2021, which produced 91,906 live-birth deliveries and 97,128 infants. For patients using their own eggs, the national success table has four age bands. Its headline measure is live births per intended egg retrieval, which counts every cycle that started, even ones cancelled before any eggs were collected.
| Measure (own eggs, 2021) | Under 35 | 35 to 37 | 38 to 40 | Over 40 |
|---|---|---|---|---|
| Intended egg retrievals | 52,165 | 33,020 | 31,834 | 27,754 |
| Live births per intended retrieval | 50.7% | 36.3% | 23.3% | 7.9% |
| Singleton live births per intended retrieval | 47.0% | 34.0% | 22.0% | 7.5% |
| Live births per actual retrieval | 53.7% | 39.7% | 26.4% | 9.4% |
| Live births per transfer | 49.1% | 44.8% | 40.2% | 24.4% |
| Intended retrievals per live birth | 2.0 | 2.8 | 4.3 | 12.7 |
Patients grasp the last row fastest, because on average a woman under 35 needs about two started cycles per baby, and a woman over 40 needs 12.7. These are national averages for whole age groups, and they can’t predict any one patient’s result.
Medigencies take: Put “intended retrievals per live birth” on your age pages in plain words, for example “about 2 started cycles per baby under 35.” Patients budget time and money by the cycle. Most people can’t do much with a bare 23.3%, but tell a 39-year-old to plan for about four cycles and she has a number to take to her partner or her boss.
How Much IVF Success Drops in Each Age Band After 35
We worked out how far each band falls below the under-35 rate. Per intended retrieval, the chance is 28% lower at 35 to 37, 54% lower at 38 to 40 and 84% lower once a patient passes 40, even though each step down loses a similar 13 to 15 percentage points.
So the relative fall gets steeper with every band. Going from the 35 to 37 band into 38 to 40 cuts the rate by 36%. The next step, into the over-40 band, cuts it by 66%.
Medigencies take: The biggest relative fall comes after 40, but by then a clinic has missed its best window. Reach patients before 38, while each started cycle still has better than a 30% chance. Aim egg freezing pages and “when to see a specialist” guides at women in their early and mid thirties. Put the 6-month mark in that content too, since New York’s insurance regulator defines infertility in a woman 35 or older as no pregnancy after 6 months of trying.
Why Per-Transfer Rates Look Higher for Women Over 40
For women over 40 in 2021, 24.4% of transfers led to a live birth, but only 7.9% of intended retrievals did. The per-transfer figure is 16.5 points higher, or 3.1 times the size.
Many cycles never get as far as a transfer, which is where the gap comes from. Under 35, we counted 103 transfers for every 100 intended retrievals, since frozen embryos from one retrieval can go into more than one transfer. That falls to 81 at 35 to 37 and 58 at 38 to 40, and over 40 it is 32, so at least two in three cycles started by these women end with no embryo transfer at all.
| Age band | Transfers per 100 intended retrievals | Per-transfer rate | Per intended retrieval rate | How much larger the per-transfer figure is |
|---|---|---|---|---|
| Under 35 | 103 | 49.1% | 50.7% | 0.97 times |
| 35 to 37 | 81 | 44.8% | 36.3% | 1.23 times |
| 38 to 40 | 58 | 40.2% | 23.3% | 1.73 times |
| Over 40 | 32 | 24.4% | 7.9% | 3.09 times |
Medigencies take: Quote only per-transfer rates on an over-40 page and you show a number three times larger than the odds a patient faces when she starts treatment. SART does not let member clinics present their results that way, with the per-retrieval figure missing. Lead with per intended retrieval and explain the per-transfer figure as “your chance once an embryo is ready to transfer.”
Who Starts IVF Compared With Who Takes a Baby Home
To estimate births per group, we multiplied each band’s intended retrievals by its live birth rate. Women under 35 started 36% of own-egg cycles and had about 55% of the births. Women 38 and over started more, 41%, yet had only about one birth in five.
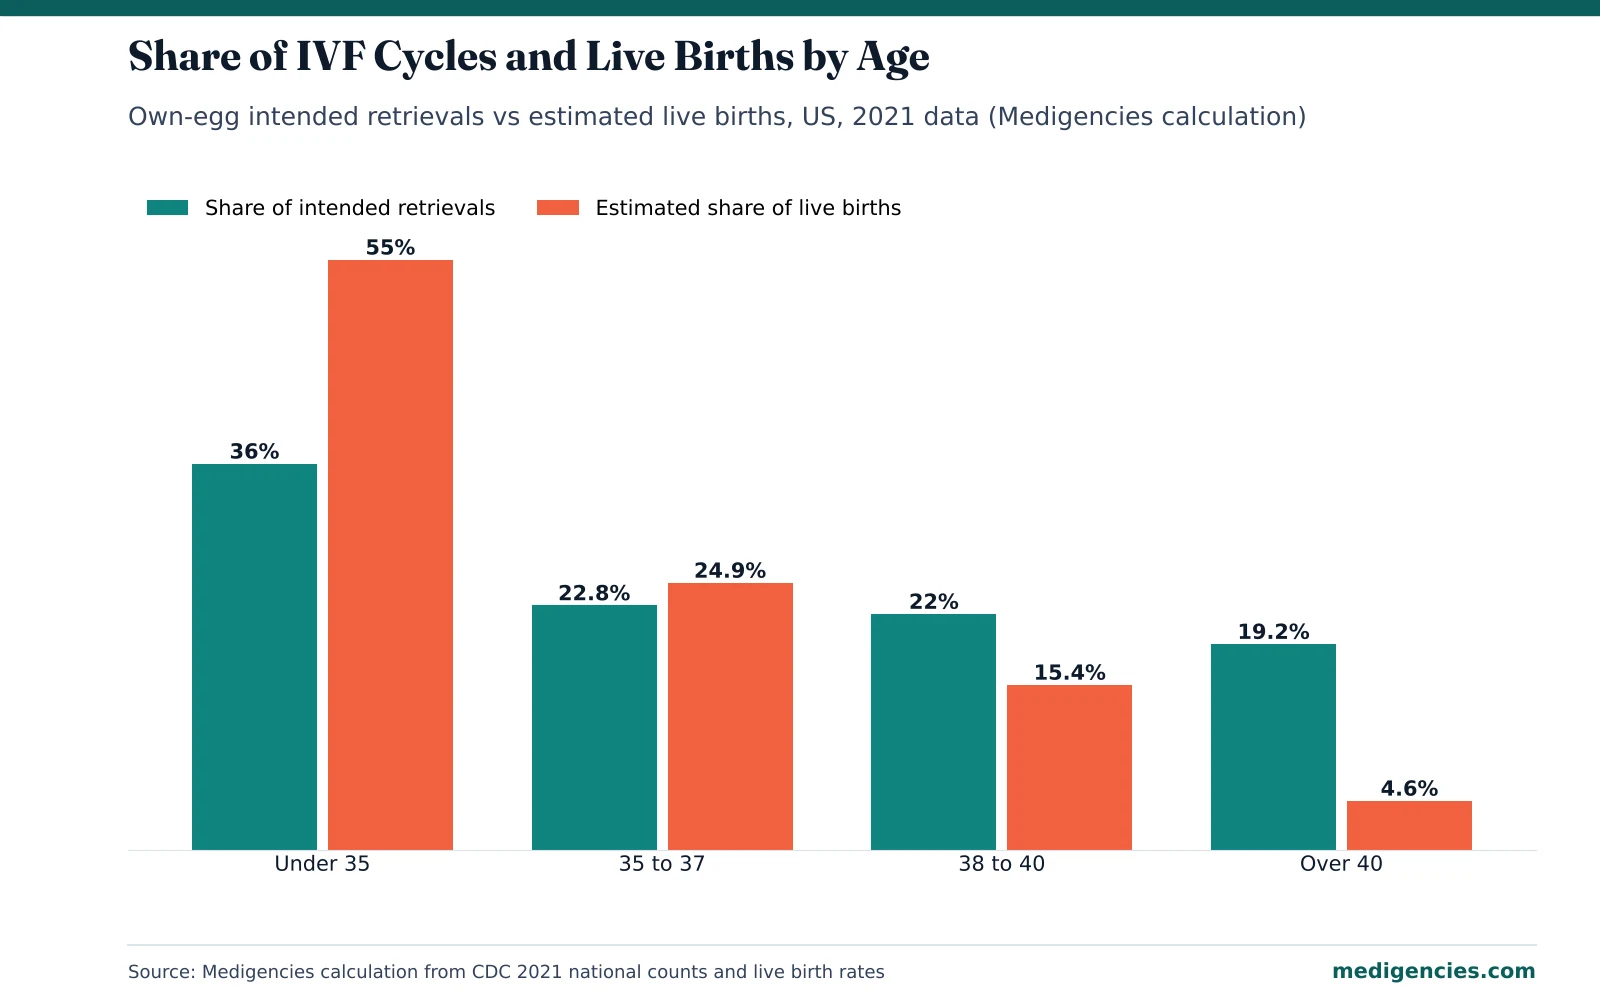
The gap is widest over 40, at 19.2% of intended retrievals against about 4.6% of estimated births. We built these shares from the national table, and they cover own-egg patients only.
Medigencies take: Two in five people starting own-egg IVF are 38 or older, and a site written only for young couples ignores every one of them. Give older patients their own pages, with real per-cycle odds and a fair account of donor eggs, and keep every number on those pages in the form SART asks for.
The Cumulative Maths Behind Two, Three or Six IVF Cycles
If the 50.7% chance per started cycle held steady, a woman under 35 would reach 75.7% after two cycles and 88.0% after three. The same sum for a woman over 40 gives 15.2% and 21.9%.
That shortcut runs high, and by a wide margin. A JAMA study followed 156,947 UK women through 257,398 IVF cycles started between 2003 and 2010. Among women under 40 using their own eggs, 32.3% had a live birth from the first cycle, and a prognosis-adjusted 68.4% had one by the sixth. Run the shortcut on 32.3% over six cycles and you get 90.4%, which is 22 points too high. Women aged 40 to 42 went from 12.3% after one cycle to 31.5% after six, while the shortcut predicts 54.5% for them.
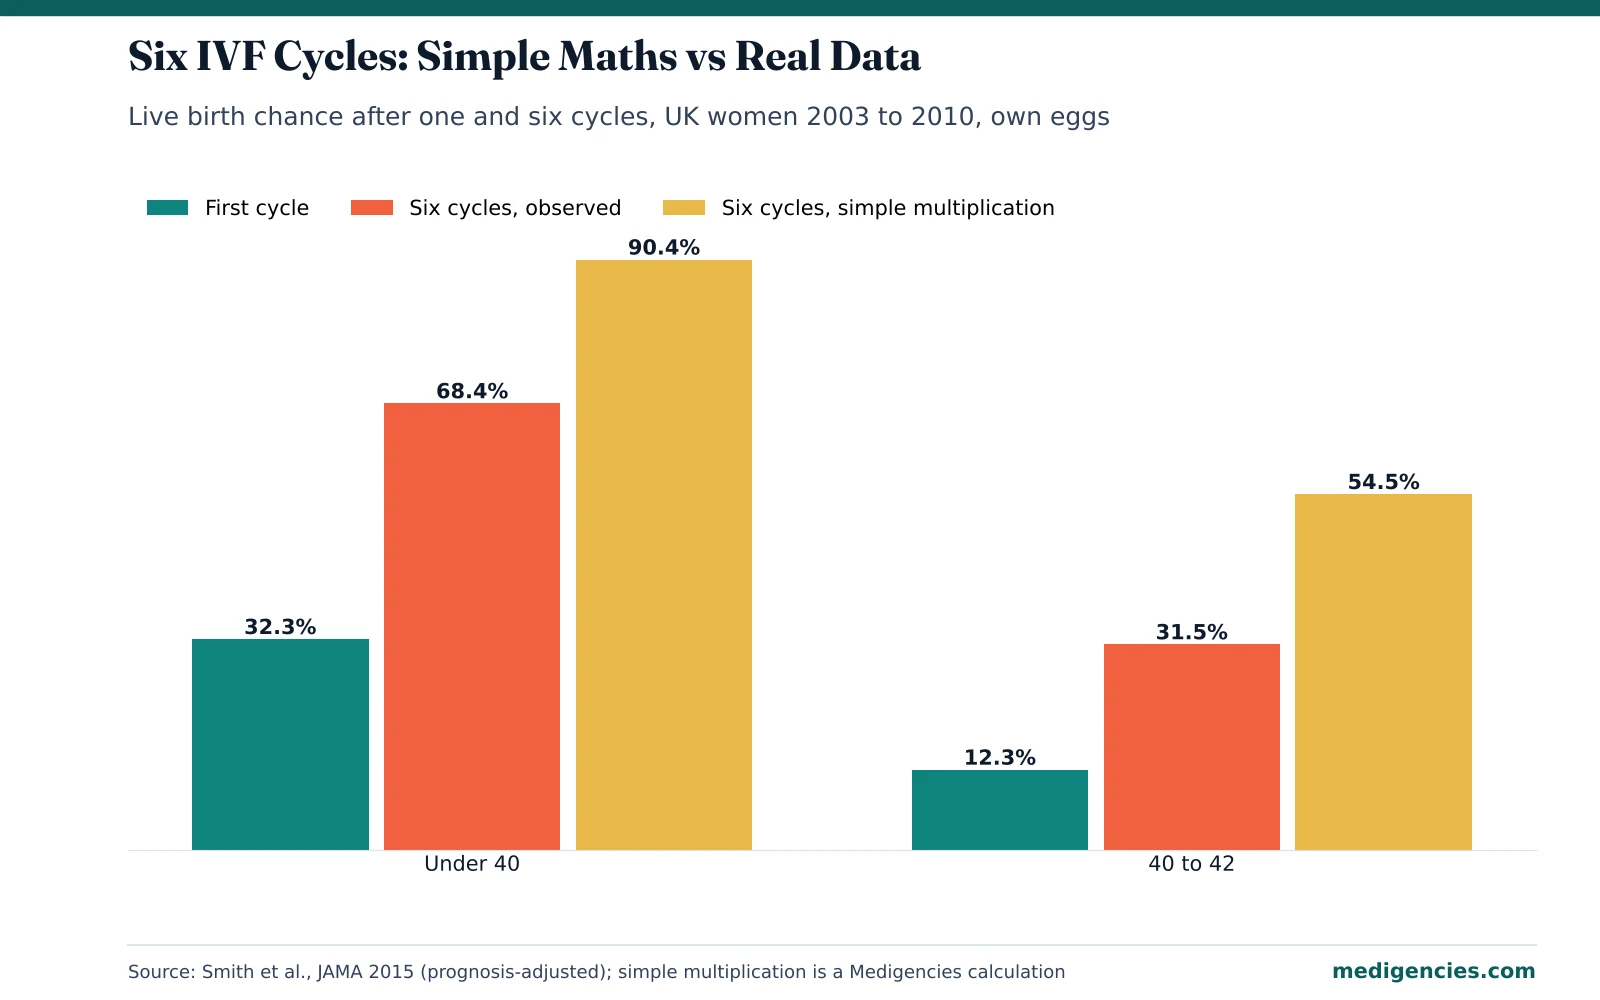
Most likely, the patients who succeed early stop coming, and the women still in treatment by the fourth or fifth round tend to have poorer odds from the start.
Medigencies take: Never publish a “your odds after three cycles” figure built by multiplying a single-cycle rate. If you want a multi-cycle number, quote a published cumulative study with its population and years, or else use the “intended retrievals per live birth” row. Explain multi-cycle packages and shared-risk programs with those real cumulative figures too.
What Started Cycles Per Baby Mean in Dollars
CCRM Fertility publishes a range of $12,660 to $20,855 for one IVF cycle with fresh eggs on its IVF cost page. That range excludes anesthesia, testing, medication and storage. We multiplied that range by the intended retrievals per live birth in each age band.
| Age band | Started cycles per live birth | Cycle cost per baby, low end | Cycle cost per baby, high end |
|---|---|---|---|
| Under 35 | 2.0 | $25,320 | $41,710 |
| 35 to 37 | 2.8 | $35,448 | $58,394 |
| 38 to 40 | 4.3 | $54,438 | $89,677 |
| Over 40 | 12.7 | $160,782 | $264,859 |
Medigencies take: Most cost pages stop at the price of one cycle. A 39-year-old should also see the national average of 4.3 started cycles per baby, so her financing talk starts from a realistic total. Link from there to your egg freezing and donor egg pages, because both change the cost per baby.
Donor Egg IVF Success Compared With Own Eggs Over 40
US donor egg figures are counted per transfer, with all recipient ages lumped together. In 2021, 53.5% of transfers using fresh embryos from fresh donor eggs ended in a live birth. The rate was 45.8% with fresh embryos from frozen donor eggs, 46.3% with frozen embryos and 42.3% with donated embryos.
Our comparison puts donor egg transfers at 1.7 to 2.2 times the 24.4% per-transfer rate for women over 40 using their own eggs. The two groups differ, so treat that ratio as a rough guide for content planning.
| Egg or embryo source (2021) | Transfers | Live births per transfer | Compared with own eggs over 40 (24.4%) |
|---|---|---|---|
| Fresh embryos from fresh donor eggs | 1,113 | 53.5% | 2.19 times |
| Fresh embryos from frozen donor eggs | 2,859 | 45.8% | 1.88 times |
| Frozen embryos from donor eggs | 17,885 | 46.3% | 1.90 times |
| Donated embryos | 3,118 | 42.3% | 1.73 times |
Medigencies take: Assume the person reading your donor egg page has just had a failed cycle. Show the per-transfer figures, then explain how donors are screened and what counseling recipients get. Some readers will choose one more own-egg cycle, and the page should leave that door open.
UK IVF Birth Rates by Age From the HFEA
In 2024, UK clinics averaged a 30% birth rate per embryo transferred for patients using their own eggs, with fresh and frozen transfers counted together. Ten years earlier, in 2014, the average was 20%. Patients aged 18 to 34 did best, at 38%, while at 43 to 44 the rate was 8%, and the 2024 birth figures are still preliminary.
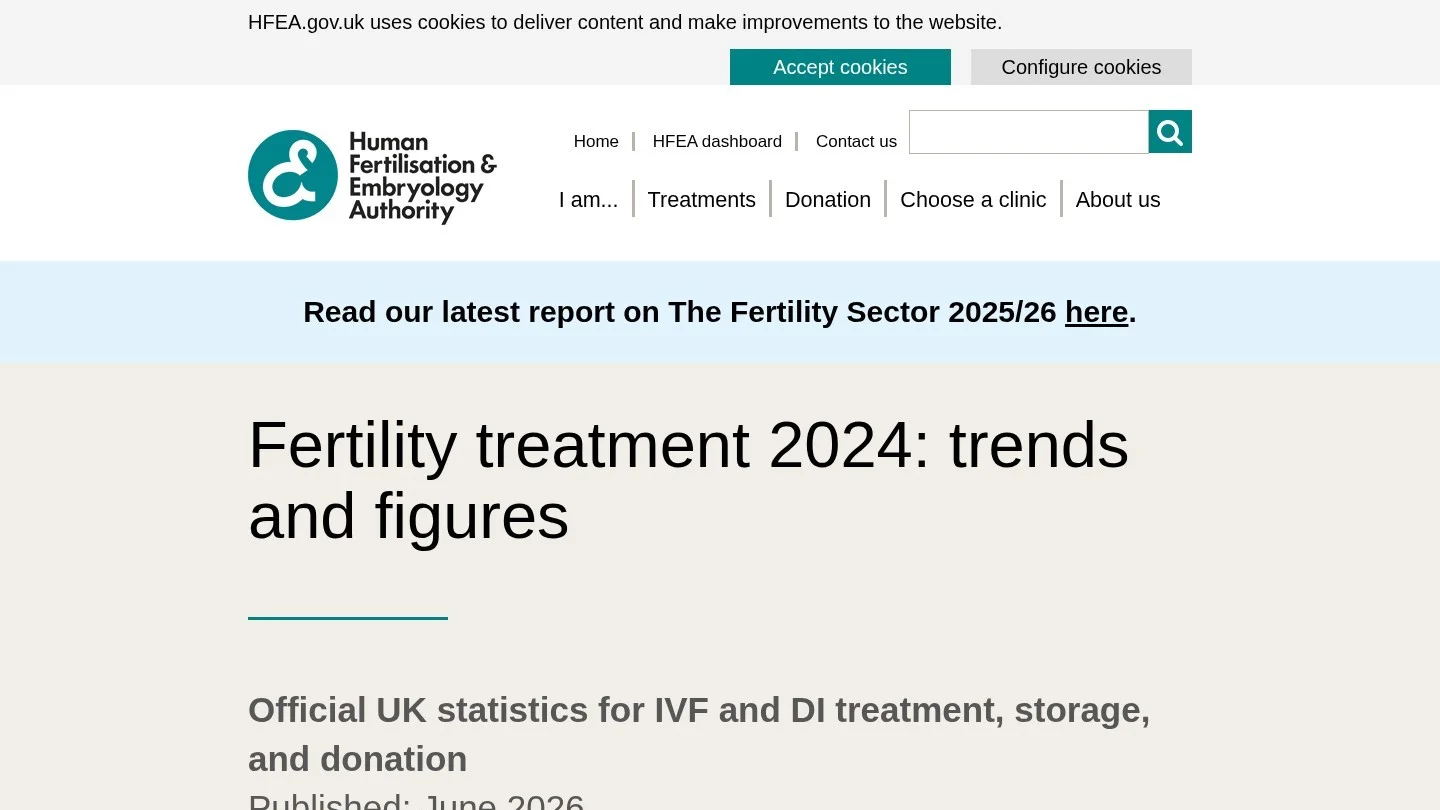
Ethnicity made a difference too, at least in the UK figures. Among patients aged 18 to 37 treated in 2022 to 2024, Asian and Black patients had a 30% birth rate, against 36% for White patients and 35% for patients of Mixed ethnic background. In 2024 the UK multiple birth rate dropped to 3.2%, and the average IVF patient was 34.8 years old.
Medigencies take: Keep UK and US rates apart on a clinic page. The HFEA figure is per embryo transferred, and the US headline figure is per intended retrieval. If you write for expat or international patients, say which measure each number uses before you quote it.
US IVF Volume in 2022 and the Shift to Single Embryo Transfer
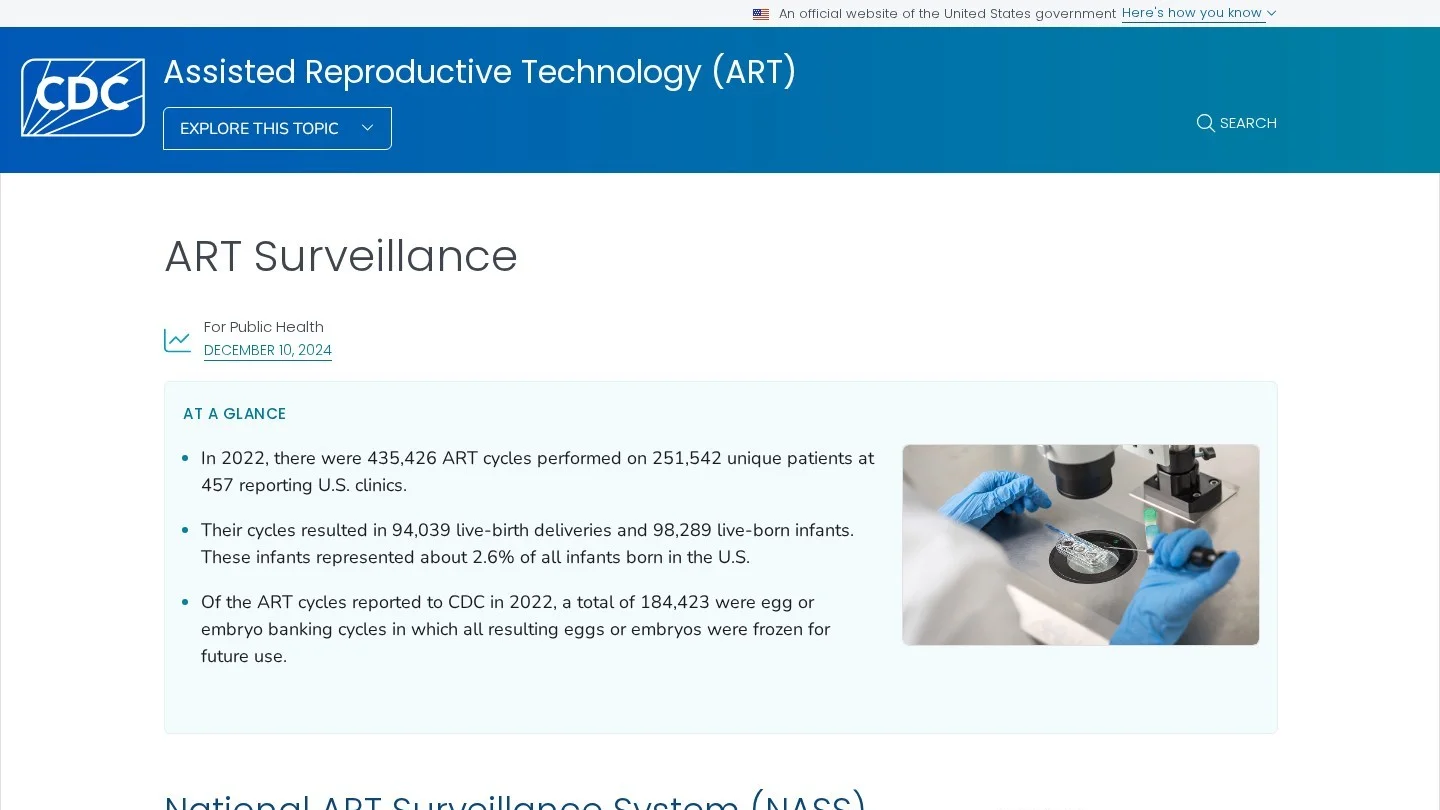
In 2022, 457 reporting US clinics ran 435,426 ART cycles for 251,542 patients. Those cycles produced 94,039 live-birth deliveries and 98,289 infants, about 2.6% of all babies born in the US that year. Of the cycles, 184,423 were egg or embryo banking cycles, with everything frozen for later use.
Single embryo transfer is now standard, with one embryo used in 24.8% of transfers in 2012 and in 82.9% by 2021. By our count, banking made up about 42% of all 2022 cycles, which means a lot of patients are freezing now and deciding later.
Medigencies take: A banking patient searches for egg freezing cost and the best age to freeze, then may not come back for years. Plan your follow-up around that gap, with yearly storage reminders and useful reading, and judge the program on thawed-egg cycles years later as well as on first visits.
Success Rate Claims SART and the FTC Allow Fertility Clinics
Most US clinics follow SART’s advertising policy for member clinics, last revised in July 2022. A clinic that publishes success data must, at minimum, put a direct link to its Clinic Summary Report on SART’s website prominently at the top. Live births per cycle start (intended retrieval) go first, and a partial presentation that leaves that figure out is not allowed.

Rankings and claims of superiority are banned outright, and a comparison with SART national data has to use the same reporting year and SART’s age categories. Any clinic quoting its own numbers must also state that comparing clinic success rates may not be meaningful, since patient characteristics and entry criteria vary between clinics. A clinic that ignores a correction request goes through a staged process, which can end with a warning banner on its SART data and a review of its membership.
Patient stories fall under FTC rules. If a testimonial suggests a result patients can expect, the advertiser needs proof that the result is typical, or has to clearly disclose the generally expected results. A line such as “Results not typical” or “Individual results may vary” won’t fix a misleading testimonial. Clinics also can’t tie a discount or any other reward to a positive review.
| Write this | Avoid this | Rule behind it |
|---|---|---|
| Live births per intended retrieval by SART age group, with a link to the clinic’s SART report at the top | Per-transfer or pregnancy rates shown on their own | SART advertising policy |
| “Our rates and the national average for the same reporting year” | “Highest success rates in the state” or any ranking | SART advertising policy |
| Patient story plus the clinic’s age-matched live birth rate near it | A 44-year-old’s own-egg success story with “results may vary” | FTC Endorsement Guides |
| “About 4 started cycles per baby at 38 to 40, based on CDC national data” | “Your odds after 3 cycles are 55%” built by multiplying one cycle | FTC rule against unsupported claims; cumulative study data |
| Reviews collected from every patient with no reward attached | A discount offered for a five-star review | FTC Endorsement Guides |
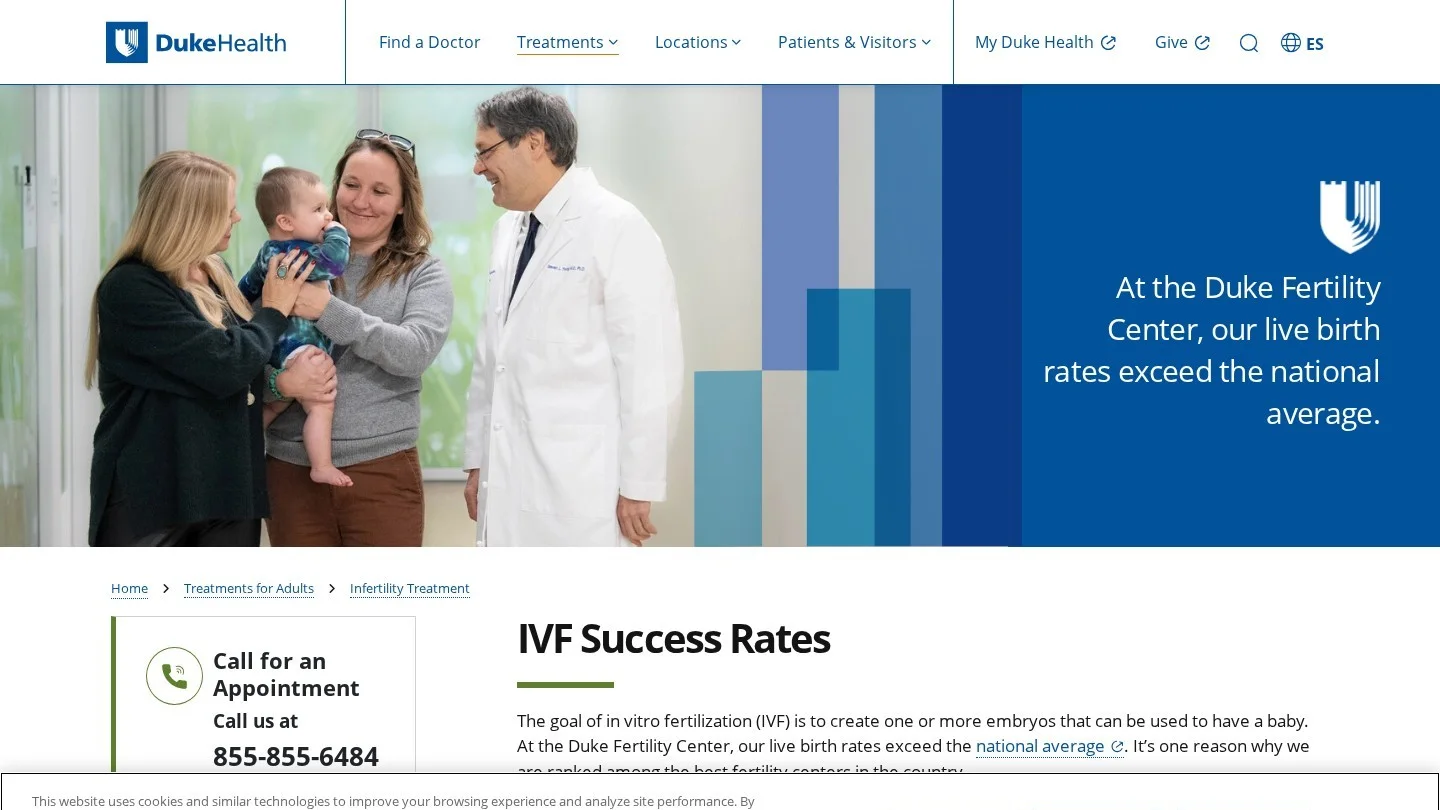
Copy the layout of Duke Health’s IVF success page. It opens with live births per intended egg retrieval for 2023 and links to Duke’s SART report. Your version also needs the comparison statement SART requires.
If an outside team runs your review requests, the same FTC rules bind them. Our guide to healthcare reputation management agencies lists teams that do this work for clinics.
An Age-Based Marketing Plan for a US Fertility Clinic
We wrote one message per national age band, plus one for women in their early thirties who are not trying yet. The plan leans on search ads and organic content, because Google limits audience targeting for health ads.
| Patient group | What the data says | Message to lead with | Best channels | Avoid |
|---|---|---|---|---|
| Under 35, trying for 12 months | 50.7% per intended retrieval; 2.0 cycles per baby | When to get tested and what a first visit covers | Organic guides, search ads on “fertility testing” terms | Pushing IVF before a work-up |
| 35 to 37, trying for 6 months | 36.3%; 28% lower than under 35 | Why 6 months is the evaluation point after 35 | Search ads, OB-GYN referral pages | Fear-based “clock is ticking” lines |
| 38 to 40 | 23.3%; 58 transfers per 100 started cycles | Honest odds per cycle and multi-cycle planning | Age-specific landing pages, financing pages | Per-transfer rates shown alone |
| Over 40 | 7.9% own eggs; donor transfers 42% to 54% | Own-egg odds and donor options side by side | Consult-led pages, second opinion pages | Success stories without age-matched data |
| Early 30s, not trying yet | Rates are 28% lower at 35 to 37 and 54% lower at 38 to 40 | Egg freezing education and cost | Organic content, YouTube explainers, email | Promises that frozen eggs guarantee a baby |
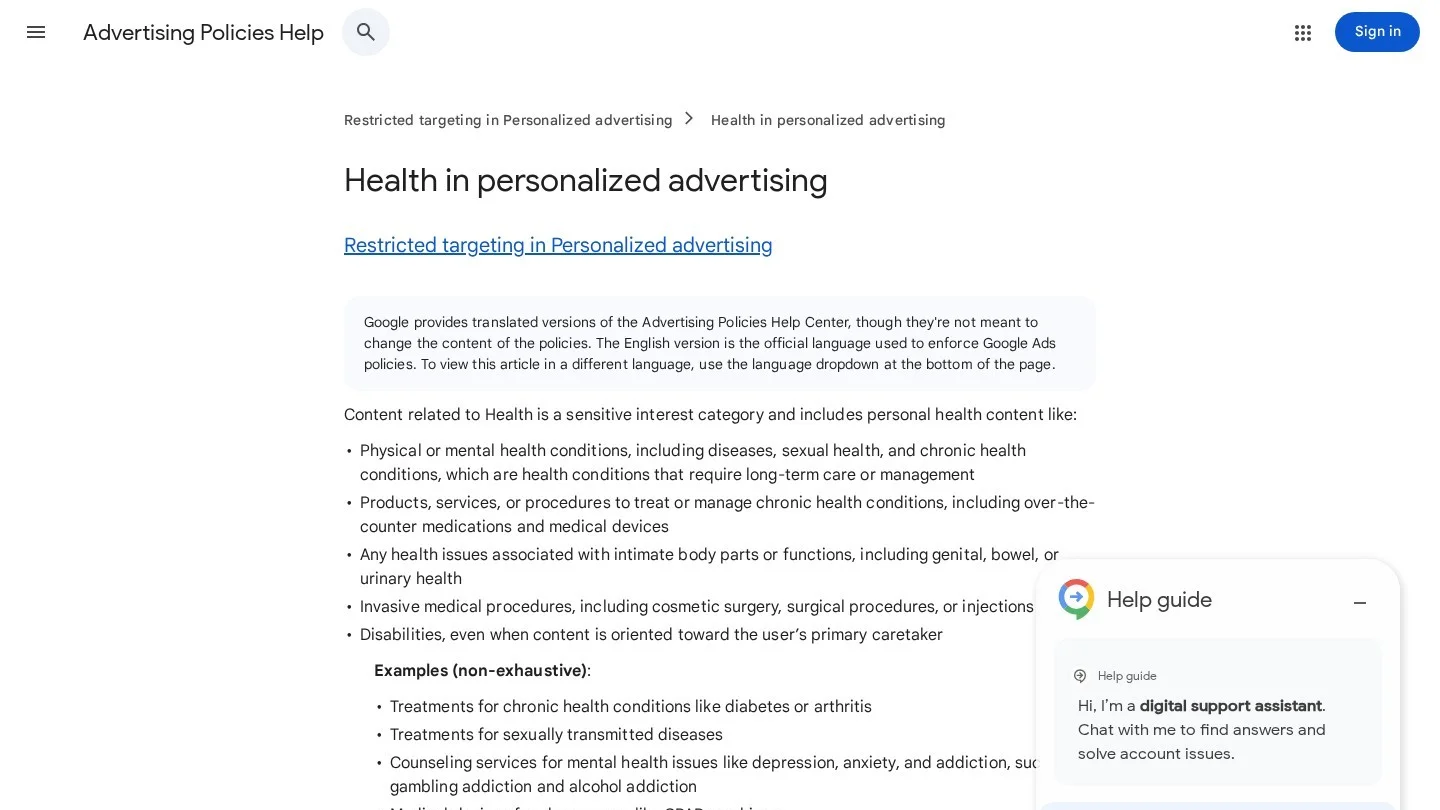
Google treats infertility treatment as a sensitive interest category. Its health in personalized advertising policy lists “treatments for pregnancy and infertility” and does not support customer match, your data segments, audience expansion or lookalike segments for these ads. Keywords and predefined Google audiences still work, and the full policy set is in our guide to Google’s healthcare ad rules.
So keyword choice does most of the targeting work for a fertility clinic’s search campaigns. Our list of IVF clinic keywords grouped by patient stage pairs each age question with a page and an ad group. Cost benchmarks for health search ads are in our healthcare PPC statistics.
For outside help, compare fertility marketing agencies, or go straight to fertility SEO agencies and fertility PPC agencies. Women’s health groups that offer fertility care alongside OB-GYN services can start with our women’s health marketing agencies list.

Questions Patients Ask About IVF Odds at Each Age
What Is the IVF Success Rate at 35?
Age 35 is in the 35 to 37 band. In 2021, 36.3% of intended egg retrievals in that band ended in a live birth with the patient’s own eggs, and it took 2.8 started cycles per baby on average.
What Are the Chances of IVF Working at 40?
Age 40 sits in the 38 to 40 band, where 23.3% of intended retrievals led to a live birth in 2021. Past 40, the rate dropped to 7.9%. A doctor can give a personal estimate based on tests such as ovarian reserve.
How Many IVF Cycles Does It Take to Have a Baby?
On 2021 US national figures, it took an average of 2.0 started cycles per live birth under 35, 2.8 at 35 to 37, 4.3 at 38 to 40 and 12.7 over 40. In a large UK study, 65.3% of women had a live birth by their sixth cycle on a prognosis-adjusted basis.
Are Donor Egg IVF Success Rates Affected by Age?
US donor egg rates are published for all recipient ages combined. In 2021, transfers of fresh embryos from fresh donor eggs led to a live birth 53.5% of the time. That is more than twice the 24.4% per-transfer rate for women over 40 using their own eggs.
Why Do Clinics Show Different Success Rates for the Same Age?
Clinics may report per transfer, per retrieval or per intended retrieval, and these give very different numbers. Patient mix also differs between clinics, which is why SART requires member clinics to show live births per intended retrieval first and to say that comparing clinics may not be meaningful.
CDC, SART, HFEA and Study Pages Behind These Figures
- CDC, 2021 Assisted Reproductive Technology Fertility Clinic and National Summary Report
- CDC Stacks, 2021 ART Fertility Clinic and National Summary Report record
- CDC, Assisted Reproductive Technology Surveillance at a Glance (2022 data)
- Smith et al., Live-Birth Rate Associated With Repeat In Vitro Fertilization Treatment Cycles, JAMA 2015
- HFEA, Fertility Treatment 2024: Preliminary Trends and Figures
- SART, Advertising Policy for ART Programs (revised July 2022)
- SART, Understanding the SART Clinic Report
- FTC, Endorsement Guides: What People Are Asking
- Google Ads, Health in Personalized Advertising
- New York DFS, IVF and Fertility Preservation Law Q&A Guidance
- CCRM Fertility, IVF Cost
- Duke Health, IVF Success Rates
Compare Agencies for This Topic
Fertility Clinic Marketing AgenciesWomen's Health and OB-GYN Marketing AgenciesHealthcare Content Marketing AgenciesHealthcare SEO Agencies
More From the Blog

Statistics
Private Hospital vs Public Hospital Cost Statistics
Hospital costs by ownership in the US, India and the UK, with our own ratios, growth rates and price-page advice for hospital marketers.
Nov 5, 2026

Statistics
Healthcare Mobile Search Statistics
Smartphone ownership, online health lookups by age, portal app use, telemedicine and page speed limits, with our own per-1,000-adults model for clinics.
Nov 5, 2026

Statistics
Healthcare Digital Marketing ROI Statistics
Hospital ad effects, health system marketing budgets, cost per patient by channel and Google's return claim, with our own math for clinics and hospitals.
Nov 5, 2026